Over the past decade we have been engaged in creating and investigating innovative learning environments in differential equations (DEs) that make use of a wide range of technologies, from applets to mainstream software such as Maple and Mathematica (see Rasmussen and Kwon [1] for an overview of this work). A key distinguishing feature of the applets we use is that they do much less for users than many of the prepackaged, commercial software tools. For example, Maple does many things for a user, including symbolically solving a DE, computing and plotting numerical approximations, varying a parameter and illustrating the effect of the parameter on the family of solutions, etc. These mathematical activities typically presuppose that students have a certain familiarity with fundamental concepts, methods for analysing DEs, and ways to visualise solutions and then provide the students opportunities to interpret results. In contrast, we intend these applets to be used as a step before working with more sophisticated software tools. The reason for this is because they are intended to help students create fundamental concepts and methods that are then needed to sensibly use more sophisticated software tools. Our experience with such applets suggests a fundamental design principle – less is more.
Mies van der Rohe, the famous German-born architect, is often associated with the phrase ‘less is more’ because of his minimalist architectural style in which the less complicated is preferred over the more elaborate. In a similar spirit, we have found it productive for students to first play with more minimalist applets to reinvent basic ideas before moving on to more sophisticated technologies that do more with more.
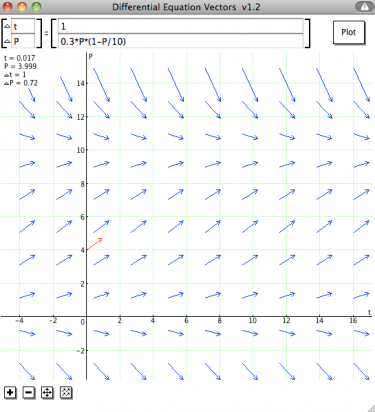
Figure 1: DEVectors applet created for
In this report we illustrate a less-is-more applet that students use at the beginning of a first course in DEs. The applet requires the user to input a DE and then simply allows the user to move a point and its associated tangent vector around in a corresponding slope field (also referred to as a tangent vector field). The applet does not sketch in a solution or provide any type of analytic or numerical solution. This minimalist approach requires students to creatively imagine the behaviour of the solution functions for the given DE. As a result, students have the opportunity to conceptually distinguish between an exact solution and an approximate solution and eventually reinvent Euler’s method. Before providing more detail on this applet, we first provide some theoretical background that guides our work.
1. Background
We have found the idea of boundary object to be a useful way to characterise the applets we use in DEs. Boundary objects are mathematical symbols, technology, documents, software, or other items that allow people to cross between different communities and work together [2]. In our case, the two communities involved are the local classroom community and the broader mathematical community as represented by the course instructor and textbook. Applets can function as boundary objects when they enable students to enter the world of mathematics through investigation and discovery. The practical significance of boundary objects is that they enable newcomers (in our case students) to participate in authentic mathematical practices [3], hence crossing boundaries between the classroom community and the broader mathematical community.
Hoyles, Noss, Kent and Bakker [4] adapted the notion of boundary object to the workplace and developed what they refer to as technology-enhanced boundary objects (TEBOs). TEBOs are defined to be ‘software tools that adapt or extend symbolic artefacts identified from existing work practice, that are intended to act as boundary objects, for the purposes of employees’ learning and enhancing workplace communication’ (p. 17). In a similar way, the applets we use in DEs function as TEBOs for student learning in the classroom and enculturation into the discipline of mathematics.
As pointed out by Hoyles et al. [4], a key feature of TEBOs is that ‘the meanings of the symbolic information are rendered more visible and manipulable, and therefore more accessible, by the use of interactive software tools’ (p. 17). This characterisation of TEBOs fits well with our DE applets because the symbolic information in the applets is used for visualisation and manipulation as students reinvent mathematical ideas and methods.
2. A less-is-more TEBO
The less-is-more applet, which we refer to as the DEVectors applet, displays a grid of vectors whose slopes are determined by the DE input by the user (see Figure 1). In designing the applet we had to make a choice as to where to place the vector that corresponds to the slope at any particular point in the plane. Should the vector be centred on the point? Should the tail of the vector be associated with the slope at each point? Should the vector have an arrow at its tip or not?
We chose to associate the tail of the vector with the point at which the derivative is computed to foster the imagery of starting at a particular point and travelling through the vector field. We also chose to include an arrow at the tip of the vector in order to suggest motion or movement that would lead to tracing out a curve.
When using the applet, placing the cursor over any point in the plane displays a red tangent vector with slope corresponding to the DE at that point. An example of such a red vector is shown in Figure 1 near the point (0, 4). The user can move the cursor about in the plane and the slope of the vector associated with location of the cursor changes accordingly. Thus, students can kinaesthetically experience the flow of a solution by following the vectors. The applet does not sketch any curve. The applet also allows the user to move the coordinate axes and the user can zoom in and out. The number of displayed vectors can be increased or decreased, making the visual display more or less dense.
3. Making distinctions between exact and approximate solutions
After developing the basic idea behind a slope field, students use the DEVectors applet to sketch in by hand a graph of a solution to an initial value problem. The following is typically what students are asked to do:
Use the DEVectors applet to create a tangent vector field for the rate of change equation . Place a transparency on your computer screen and use a marker to draw on the transparency, leaving a record of where you’ve been as you move a point around in the plane. Work in pairs to do this: one person works the mouse and the other person uses the marker to trace the path on the transparency.
By design, the task is open ended and hence affords different approaches. In particular, there are often two different ways that students go about this task. The first approach is to sketch out a smooth, continuously changing graph. The second is to sketch out a graph that consists of stitching together a series of vectors placed tip to tail. Prior to this task students have not been instructed on the difference between an exact solution and an approximate solution. As such, the two different approaches that students use function as the foundation on which the course instructor can make this distinction. This now opens up opportunities for students and the instructor to do more, even though the software itself did less. In particular, the class is now conceptually poised to develop analytic approaches to find exact solutions and numerical approaches for finding approximate solutions.
Moreover, the two different types of student-generated graphs can lead to some very interesting discussions about how they compare. Discussion topics typically include:
How is rate of change changing in each approach?
Which graph gives larger population values and why?
How could one make the tip-to-tail graph more like the other graph? Could the two graphs ever be identical?
How might one think about the process of going from point to point?
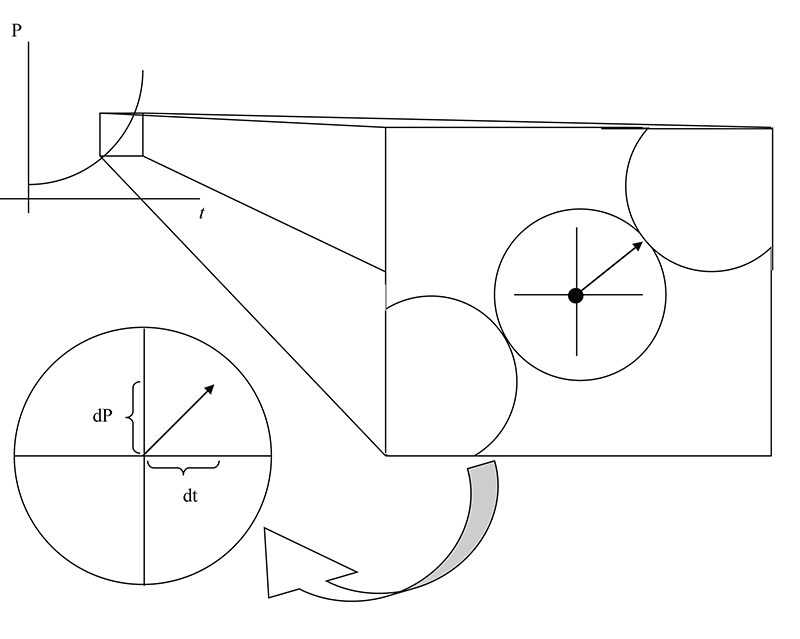
The last point has come up on occasion and led to some interesting discussions. For example, one semester in which we were collecting data for a research study, a student articulated how he thought about each point as having directionality. One goes from ‘point to point’ via the direction associated with the respective vector. For the tip-to-tail graph this way of thinking fits well and is at the heart of Euler’s method. But what about the graph with continuously changing rate of change, which the students in this particular class referred to as the ‘instantaneous method’? Can one also think about a point with directionality in the same way? Below is a student reflection on this issue.
Figure 2: A point with a directionality
I’ll admit when I was first introduced to this idea [a point with directionality], it flew right over my head. I had no way of visualising a point having a direction associated with it. I remember thinking to myself, ‘whoa, that is a real stretch for me.’ It was not until recently that it became a very powerful statement for me. So I thought to myself, ‘What the heck would a point with directionality look like?’ If you think of a line or a ‘curve’ having infinitely many points associated with it, then you might buy what I was thinking. Let us say we’re to zoom in on the graph, you would ‘see’ infinitely many points connected to make up a curve, right? (This is assuming we all agree that in order to generate a curve in two-dimensional space, we have to calculate infinitely many intervals. Therefore infinitely many points.) So, I inscribed a coordinate system inside the circle. This gave rise to a ratio that I noticed associated with the closest point of intersection to the ‘next’ point. This ratio is !! (See Figure 2.) This gave me a very powerful way of thinking about the ‘instantaneous method.’ I can physically visualise myself standing on the centre of the circle (which is a point), and staring in the direction that I am supposed to travel. That direction leads me directly to the next point … instantaneously.
The mathematical issues that this student brings up are deep and can lead to even deeper discussions about continuous and discrete process, the definition of a point, the definition of instantaneous rate of change, etc. We doubt such conversations would naturally arise if students were to use a software tool that did more for them (sketch in curves, find analytic solutions, etc.). Our point is that a software tool that does less can in fact lead to quite a bit more.
4. Reinventing Euler’s method
One follow-up from the previous task is to engage students in reinventing Euler’s method. While many of our students have seen Euler’s method in a previous calculus class, it seems that very few of them remember it or recognise it in this context. This may be because they learned the technique without deeply understanding what the procedure entails or how the procedure can be graphically understood. In any case, we use the following task as a follow up to the previous task:
Figure out a way to link the tangent vectors together to create a graph of the population versus time if at time 0 we know there are 5 fish in the lake (think of 10 as scaled for say, 1000 or 10,000). Create a table of values to match your graph.
Because students have to create a table of values corresponding to their tip-to-tail construction, they either have to rely on the numerical values shown in the top left corner of the applet (see Figure 1) or they have to devise a computational approach for themselves. Students readily realise that their ability to accurately place vectors by hand on the transparency and/or to read off the from the applet is error prone and in need of a more dependable method. Thus, as the instructional sequence continues, students are given the following two tasks that culminate in the reinvention of Euler’s method:
Without using the Java applet, create a table of values that approximates the solution to the DE , with initial condition . Check your results with the applet and provide a graph of your approximation.
Generalising your result: Create an equation-based procedure/algorithm that would allow you to generate a table of values for any DE and any given initial condition.
Keys to success on these tasks entail several conceptual milestones, including realising that each value is associated with a value, interpreting the DE as a rate of change, seeing slope as a ratio of two co-varying quantities, and figuring out how to find successive values using . The following is not atypical of how the less-is-more applet affords putting all of these ideas together (this quote comes from student work with ):
Deb: This is what I did. First I looked at the fact that this is a rate of change equation. So this is telling me how many rabbits are being produced every year. So If I know 3 times the original population is produced every year, then I have 3 times 10 is produced every year. But I want to know how many is produced in 0.5 years. So I know how many rabbits are produced per year, so if I multiply that by 0.5 then I’ll know how many more rabbits have been produced. So I take that new number that I get and add it to the old population. Uh huh, so then I find the one with my new rate of change, so I just take that population and put it in for , and that is 3 times whatever that is.
Liz: And the reason for putting in the new population would be what?
Deb: Because now my population is larger and I know the population changes at a constant of 3 times whatever that population is.
This type of reasoning by students leads naturally to symbolically expressing the tip-to-tail approach as
This reasoning shows an example of the theoretical background we discussed earlier; the less-is-more applet functions as a boundary object between the classroom community and the broader mathematical community. As students use the applet and develop the Euler algorithm, they can reinvent important mathematics and become participants in the mathematical practice of creating (and later using) algorithms.
5. Concluding remarks
In the DEVectors applet, students use the tool to visualise, develop intuitions, and reinvent important mathematics. We note that much research has shown that visualisation and conceptual understanding are often linked when learning new ideas [5–8]. This is why it is important to ground students’ new mathematical understanding in visualisation when possible.
In addition to visualisation, the applets are also animated and interactive, which provides further entry points to understand important ideas. By design, the applet does not give students the information that an expert would require, but instead requires them to participate in exploration and experimentation in order to develop insight and to motivate the need for information that an expert would like to see. As such, the DEVectors applet can function as a boundary object between the classroom mathematics community and the broader community of mathematicians.
For two other examples of TEBOs in DEs we refer readers to a book chapter by Keene and Rasmussen [9]. In the chapter one example shows how students use the DEVector applet to develop an intuitive and later formal understanding of the uniqueness theorem. In particular, students click and drag a vector to examine how the slope of the vector changes as the dependent variable changes (experts will recognise this as being related to the Lipschitz condition). This leads to an intuitive and kinaesthetic appreciation and awareness of the conditions for the uniqueness theorem, which can then be formalised by the course instructor.
In the other example, students connect an imaginary experience, making aeroplane propeller traces, to a different less-is-more applet that models a three-dimensional representation of a solution to a system of two DEs. The view of analytic solutions as two functions emerges from their looking at the three-dimensional curve and rotating it in ways that then show the –, –, and phase plane view. Our experience suggests that using this applet benefits students even after they have been provided with more complex, expert software and the students continue to rely on it throughout the semester.
We do not claim that less-is-more applets should be the only visualisation tools used in a mathematics classroom. More sophisticated software tools have their place, especially following the use of these applets. Moreover, other tasks, instructor input, student engagement in justification and investigation also work together to provide an environment that will allow students to develop their own ways of thinking about mathematics that connect with conventional and formal understandings. Our previous comparison studies, although not focused on the effect of technology per se, suggest that students in problem-based, inquiry-oriented classrooms learn concepts better and retain this knowledge longer than students in traditionally taught classrooms [10, 11]. These studies also indicate that there is no significant difference in students’ using the less-is-more applets in terms of procedural proficiency when solving DEs without any technology.
We conclude this report with a reflection on two primary affordances of the applets. First, by design the applets do much less for students in comparison to commercial software packages (and many other instructional applets). But doing less is insufficient. The applets must also offer opportunities for learners to dynamically visualise and kinaesthetically engage with fundamental ideas and to explore these ideas in creative ways. These features of the applets invite students to do more of the intellectual work. The nature of this intellectual work is inextricably linked to the second affordance – the TEBO idea. As a boundary object, less-is-more applets offer two areas of focus. The first area of focus is around the boundary object without presupposing crossing the boundary. The list of possible questions we tendered earlier around different student-generated graphs (smooth versus tip-to-tail graphs) is an example of how talk around a boundary object offers opportunities for students to compare, contrast, and build robust mathematical meanings for fundamental ideas. A second area of focus is crossing the boundary into the realm of mathematical practices. In the DEVector example, students entered the domain of authentic mathematical practice when they created the Euler method algorithm. Producing such mathematics is a way for students to be legitimate, albeit peripheral, participants in the types of activities that typify the work of mathematicians. In sum, TEBO applets are software tools that can do quite a bit more with less.
Chris Rasmussen
San Diego State University, USA
Karen Keene
North Carolina State University, USA
Acknowledgements
This material is based upon work supported by the US National Science Foundation under grant DUE 1431641. Any opinions, findings, and conclusions or recommendations expressed in this material are those of the authors and do not necessarily reflect the views of the National Science Foundation. The authors also would like to thank Richard Noss for his helpful comments on an earlier version of this manuscript.
References
Rasmussen, C. and Kwon, O. (2007) An inquiry oriented approach to undergraduate mathematics, J. Math. Behav., vol. 26, pp. 189–194.
Star, S.L. and Griesemer, J.R. (1989) Institutional ecology, ‘translations’ and boundary objects: amateurs and professionals in Berkeley’s Museum of Vertebrate Zoology, 1907–1939, Soc. Stud. Sci., vol. 19, no. 3, pp. 387–420.
Rasmussen, C., Zandieh, M., King, K. and Teppo, A. (2005) Advancing mathematical activity: a view of advanced mathematical thinking, Math. Thinking Learning, vol. 7, pp. 51–73.
Hoyles, C., Noss, R., Kent, P. and Bakker, A. (2010) Improving Mathematics at Work: The Need for Techno-Mathematical Literacies, Routledge, London & New York.
Presmeg, N.C. (1997) Generalization using imagery in mathematics, in Mathematical Reasoning: Analogies, Metaphors and Images, ed. English, L.D., Erlbaum, Mahwah, NJ, pp. 299–312.
Arcavi, A. (1999) The role of visual representations in the learning of mathematics, 21st North American PME Conference, vol. 1, pp. 55–80.
Duval, R. (1999) Representation, vision and visualization: cognitive functions in mathematical thinking: basic issues for learning, 21st North American PME Conference, vol. 1, pp. 3–26.
Nardi, E. and Iannone, P. (2003) Mathematicians on concept image construction: single ‘landscape’ vs ‘your own tailor-made brain version’, 27th PME International Conference, eds Pateman, N., Dougherty, B.J. and Zillox, J., vol. 3, pp. 365–372.
Keene, K. and Rasmussen, C. (2013) Sometimes less is more: examples of student-centered technology as boundary objects in differential equations, in Enhancing Mathematics Understanding Through Visualization: The Role of Dynamical Software, ed. Habre, S., IGI Global, Hershey, pp. 12–36.
Kwon, O.N., Rasmussen, C. and Allen, K. (2005) Students’ retention of knowledge and skills in differential equations, School Sci. Math., vol. 105, no. 5, pp. 227–239.
Rasmussen, C., Kwon, O., Allen, K., Marrongelle, K. and Burtch, M. (2006) Capitalizing on advances in mathematics and K-12 mathematics education in undergraduate mathematics: an inquiry-oriented approach to differential equations, Asia Pac. Educ. Rev., vol. 7, pp. 85–93.

. Place a transparency on your computer screen and use a marker to draw on the transparency, leaving a record of where you’ve been as you move a point around in the plane. Work in pairs to do this: one person works the mouse and the other person uses the marker to trace the path on the transparency.
!! (See Figure 2.) This gave me a very powerful way of thinking about the ‘instantaneous method.’ I can physically visualise myself standing on the centre of the circle (which is a point), and staring in the direction that I am supposed to travel. That direction leads me directly to the next point … instantaneously.
values to match your graph.
 values that approximates the solution to the DE
  , with initial condition
  . Check your results with the applet and provide a graph of your approximation.
 value is associated with a
  value, interpreting the DE as a rate of change, seeing slope as a ratio of two co-varying quantities, and figuring out how to find successive
  ):
):![\[ P_\text{next} = {{P_\text{now}} + {\left({\frac{\rd P}{\rd t}}\right)}_\text{now}\times{\Delta t}}. \]](https://ima.org.uk/wp/wp-content/ql-cache/quicklatex.com-c3c5bdbd361f09aefe9ef98773f777d8_l3.svg "Rendered by QuickLaTeX.com")
 –
– ,
,  –
–

