 Football matches, pilgrimages and political protests all have one thing in common: people. Lots of them. Whenever people gather in large numbers, whether it’s to pray to sporting deities or wailing walls, there is always the potential of danger. The main aim of the organisers in such situations is to keep people safe.
London’s annual New Year celebrations are just one example of where the mathematics of crowd dynamics is used – up to 200,000 people can gather on the banks of the Thames to witness the fireworks first-hand, as Big Ben puts an end to the past year. However, there is only a fixed amount of space in the designated viewing areas – they can only fit a pre-determined number of spectators.
This means that once the viewing areas are full no-one else can get in. Without careful planning this would lead to a large volume of people, many of them frustrated, stuck in the feeder channels. They would be unable to get into the viewing areas, but unable to head back due to the large number of people behind them. That is recipe for potential danger.
Instead, the situation is carefully controlled using a combination of crowd sampling and mathematical modelling. A important mathematical tool is the event’s likely arrival profile – a graph showing the number of people likely to arrive over time. Different kinds of events have typical arrival profiles of different shapes. Knowing the likely mathematical pattern of arrivals is a key piece of information. For example, an all standing concert may see many early arrivals with people wanting to grab the best view. Conversely, an all-seater gig, where people are guaranteed their assigned seat, would more likely see them leaving it later to show up.
The London fireworks is an unticketed event: people can turn up as and when they like. This means many people will leave it until as late as possible to try and get a space in order to avoid waiting around in the cold. This allows organisers to predict the shape of the event’s arrival profile. However, organisers need to use crowd sampling to dress their graph with numbers – a one minute sample count of the spectator flow rate is taken every 15 minutes. The flow rate is measured as the number of people passing a marker in a set amount of time. These sampled flow-rates can be plotted on the graph and the shape of graph will give the organisers a prediction of future crowd numbers valid for up to an hour in advance.
 This allows them to “turn off the taps”, stopping anyone entering the feeder routes who won’t be able to make it into the viewing areas. In the case of the London fireworks, once the viewing area reaches 80% of capacity no-one else is allowed into the feeder channels – those already in the channels will fill the remaining 20% of room. The same technique can be used to send well-timed information even further upstream to places such as Underground stations, alerting passengers that capacity has been reached.
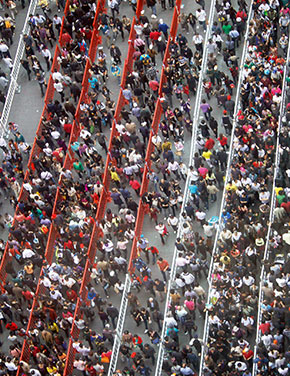
However, modelling and sampling of arrival rates is only half the battle. Mathematics also plays an integral role in designing a safe initial infrastructure. Working out the best way to fill a fixed space is an example of what is known in mathematics as an optimisation problem. You want to optimise the design of the feeder channels so that they most efficiently, and safely, fill the viewing area. If the flow rate is too low then people dawdle, too high and people get bunched together prevented from moving forward by the person in front. Mathematical analysis has shown the optimal flow rate occurs when there are between two and three people per square metre.
With this in mind, the set-up is designed to try and keep the density of people around this optimum level. As the situation on the ground changes, and the number of people flowing through the system varies, organisers can also widen or “pinch off” areas in order to increase or decrease the density and maintain the optimum flow rate.
When attending big events such as rock concerts or firework displays people are often focussed on the excitement and enjoyment of the experience. Mathematics allows them to do so in the safest possible way.
Technical Supplement
Arrival profile
Due to the unticketed nature of the London fireworks display, and the often chilly conditions of a late December night, people leave it as late as possible to turn up. This means the event’s arrival profile is described by an exponential curve. The crowd sampling gives initial values of crowd numbers with which to extrapolate the exponential growth in crowd numbers up to an hour in advance.
Infrastructure
Designing the infrastructure for event is a crucial part of keeping people safe as it is done before anyone even arrives. Modelling how the crowd flows through the design combines the related disciplines of spatial analysis, network analysis and agent-based analysis. The latter aims to model the behaviour of crowd members and includes elements of game theory.
The IMA would like to thank Prof. Keith Still, Buckinghamshire New University, for his help in the preparation of this document.
Printable Version
Download a printable version of this paper here:


