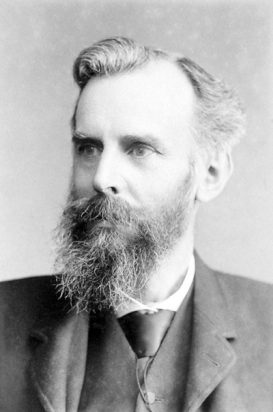
John Venn is mostly remembered as the inventor of the famous diagram that bears his name. It is still widely used today, for instance, to solve problems in set theory and to test the validity of syllogisms in logic.
Like Euler diagrams or truth tables, Venn diagrams summarise and present certain information and, in the best case, they also generate new information. Given their similarities, Euler and Venn diagrams are often mentioned in the same breath or even said to be essentially one and the same. Both are formed by using circles, are intuitively understandable and sometimes look alike. The fact is, however, that they are very different. For one thing, there are many Euler diagrams that cannot be Venn diagrams, and vice versa.
The long-standing confusion of Euler and Venn diagrams points to an interesting paradox – or an irony, perhaps. Venn is best remembered for the Venn diagram, which, at least in its form of three overlapping circles, is of Google Doodle fame. At the same time, its nature is often misunderstood and almost nothing is known about its origin. There is a whole literature on the first point. In this short note, I would like to briefly reflect on the second.
Venn first published his diagrams in 1880 in a paper which appeared in the Philosophical Magazine [1]. His method for making them consisted of a two-step procedure: first, draw a primary diagram that represents the combinations between the terms involved in a proposition or an argument; second, add syntactic signs, like shading, onto this scheme to indicate the state of the sub-classes. Thus, ‘All  is
is  ’ (i.e. ‘The sub-class
  is empty’) would go like this: make a two-term diagram (Figure 1) to represent
  , ,
, ,  , and
, and  ; and then shade (stripes in Figure 2) the compartment to obtain the diagram of the proposition.¹


The reason why almost nothing is known about the origin of Venn diagrams is as simple as it is mysterious: there is no mention of them at all in Venn’s own writings or correspondence prior to 1880, and in his autobiography, Venn dryly reports that he ‘first hit upon’ Euler diagrams in 1862 and that his own diagrams ‘did not occur to [him] till much later’ [2, p. 70]. His description of the journey that led him to their invention is brief and hardly insightful [1, p. 4]:
I tried at first, as others have done, to represent the complicated propositions [of Boole] by the old [Eulerian] plan; but the representations failed altogether to answer the desired purpose; and after some consideration I hit upon the plan here described.
This makes clear that Venn diagrams emerged from the attempt to adapt Euler diagrams to Boolean logic. On this basis, much can be learned about how Venn arrived at his diagrams. One can retrace the steps that opened the way to their invention, drawing together post-Eulerian developments in diagrammatic representation and Boolean logicians’ dealings with the so-called problem of elimination [3]. But all this says nothing about when and why Venn invented them.
Some people, including myself, have argued that it is likely that Venn invented his diagrams at some point in the late 1870s [4, pp. 177–208]. The circumstantial evidence is twofold. First, Venn himself wrote that they were suggested to him by his study of George Boole’s algebraic logic. Second, it was around 1878 that he finally managed to come to grips with Boole’s work.
The why question is more tricky. Any answer to it will be contextual at best. It has much to do with the Cambridge tradition of mathematics in which Venn was trained as an undergraduate. Interestingly, one aspect of this same tradition also helps us solve another mystery about Venn diagrams: namely, why he invented them but cared relatively little about bringing them to maturity.
Venn entered Gonville and Caius College, Cambridge, in 1853. Around this time, to be a serious ‘reading man’ meant to devote oneself to a three-and-a-half-year preparation for the Mathematical Tripos. While the complete hegemony of mathematics at Cambridge was broken by the establishment of the Natural Sciences Tripos and the Moral Sciences Tripos in 1851, for some time the Mathematical Tripos continued to determine who would compete for a fellowship and hence for an academic career.
During this period, it was profoundly shaped by the efforts of William Whewell (1794–1866), who strongly favoured mixed over pure mathematics.² Over the course of the 1820s to 1840s, the curriculum at Cambridge had been expanded to include more purely analytic subjects, such as elliptical integrals and Laplace coefficients. Whewell took it upon himself to replace these and other more advanced parts by the inclusion of physical subjects, ranging from electricity and magnetism to heat. He did this from the firm belief that a liberal education should be based upon Euclid and Newton and, more specifically, that intuitive geometrical methods provided the most suitable training of the student’s mind.
One outcome of Whewell’s influence was that men like Venn were trained in the Cambridge tradition of preferring visual to symbolic representation [5, 6]. Another was that the Mathematical Tripos proved a physically and mentally exhausting exercise, as students were drilled to perform standardised problems mechanically at a rapid pace [7].
As an undergraduate, Venn did not really fit the mould of the 19th-century Cambridge system of private tuition. All of the three or four private tutors he tried ‘always had the Tripos prominently in view’ [2, p. 38]. This meant that none of them made much room for those, like Venn [2, p. 38]:
Who wished to turn aside to study some detached point which interested them or to speculate about the logical and philosophical problems that arose.
When Venn sat for the Tripos in January 1857, the examination took eight days, a total of 27 hours: the first three days (Part 1) were on elementary mathematics and the next five days (Part 2) covered more advanced subjects. Venn finished Sixth Wrangler, that is, sixth in the list of first-class honours students, which he believed ‘was about [his] right place, as things were’ [2, p. 45].
Venn wrote about the all-importance of the Tripos at Cambridge [2, p. 45]:
The evil side of the system … is displayed in the re-action and disgust which … ensues when that examination is over.
Before coming to Cambridge, and for his first two years as an undergraduate, Venn had enjoyed mathematics. After the Tripos, he disliked it intensely. He even went so far as to sell all his mathematical books, and he would never return to mathematics again. Many years later, he believed his strong reaction had been a mistake. He remarked [2, p. 45]:
What has been painfully gained ought not to be let drop. Even if its study is not carried on to any further point, it should at least be retained, and utilised in other directions.
When in the 1860s and 1870s Venn came to study Boole’s algebraic logic, he indeed had to recover almost the basics of algebra. Not everything was lost, however.
Venn returned to Cambridge in 1862, after several years of working as an Evangelical curate, to transform himself into a moral scientist, educating a new generation of students in political economy, philosophy and, especially, in logic. By the 1880s, Venn actually was the leading logician at Cambridge. This status he owed partly to his intercollegiate teaching (a novelty at the time) but mostly to his influential textbooks: The Logic of Chance (1866), Symbolic Logic (1881), which contained the diagrams, and The Principles of Empirical or Inductive Logic (1889). All of Venn’s textbooks – and, indeed, almost all his academic papers – found their origin in the lecture room. Why is this important?
First of all, because it points to the fact that Venn diagrams were, at least to Venn’s own mind, primarily a pedagogical device and not, or at least much less so, an object of study in their own right. Venn himself viewed his visualisation of Boole’s logic as offering to moral sciences students what the ‘demonstrators’ in the newly founded Cavendish Laboratory were able to provide for students reading mathematics and natural sciences. As Venn wrote [8, p. 343–344]:
If any sluggish [or ‘non-mathematically trained’] imagination did not at once realise that from ‘All
is some
’, ‘No
’, we could infer that ‘No
Furthermore, it can be argued that, through his lecture room use of diagrams, Venn was importing the kind of visual reasoning learnt from the Mathematical Tripos into the new, non-mathematical subjects he taught at Cambridge in the 1860s to 1880s.
Together, these insights – very briefly sketched here – can teach us something about why Venn invented his famous diagrams: because he found them useful in presenting Boole’s logical system in a visual form that was intuitively graspable for a non-mathematical audience. And this, in turn, teaches us something – though of course not everything – about why Venn left his invention in a state of relative immaturity: what mattered to him was their function as a visual aid in solving problems. Venn did propose a plan for constructing his diagrams by which they could be extended to  number of terms. (Others, like Lewis Carroll and Allan Marquand in Venn’s own time, did this better [9].) However, to put things anachronistically, what Venn liked about and what he took to be the reason for existence of Venn diagrams was the coup d’oeil afforded by them. They show a lot, and seeing what they show takes little time.

Let me end by quoting a passage that captures Venn’s almost touchingly limited view on the possibilities for innovation of his diagrams [1, p. 16]:
For myself, if I wanted any help in constructing or employing a diagram, I should just have one of the three-, four-, or five-term figures made into a stamp; this would save a few minutes sometimes in drawing them; and we could then proceed to shade out or otherwise mark the requisite compartments.
Lukas M. Verburgt
Netherlands Institute for Advanced Study
Notes
- Following Venn,
 is not-.
 - The history of the term ‘mixed mathematics’ is complex and interesting. For Whewell, it meant an emphasis on descriptive geometry and (what would today be called) ‘applied’ mathematical subjects such as hydrostatics, optics, mechanics and astronomy. Whewell’s emphasis on mixed instead of pure mathematics was not due to a concern for mathematics’ utility, far from it: it was part of his conservative outlook, focused on the clear and definite rather than the ‘vague’ and ‘speculative’. For context see, for instance, [10], Chapters 2 and 3.
References
- Venn, J. (1880) On the diagrammatic and mechanical representation of propositions and reasonings, Philos. Mag., vol. 10, no. 5, pp. 1–18.
- Venn, J. (2022) Annals: Autobiographical sketch, in John Venn: Unpublished Writings and Selected Correspondence, ed. Verburgt, L.M., Springer, New York.
- Moktefi, A. and Lemanski, J. (2022) On the origin of Venn diagrams, Axiomathes, vol. 32, pp. 887–900.
- Verburgt, L.M. (2022) John Venn: A Life in Logic, The University of Chicago Press, Chicago, London.
- Cook, S. (2005) Minds, machines, and economic agents: Cambridge receptions of Boole and Babbage, Stud. Hist. Philos. Sci. Part A, vol. 36, no. 2, pp. 331–350.
- Cook, S. (2005) Late Victorian visual reasoning and Alfred Marshall’s economic science, Br. J. Hist. Sci., vol. 38, no. 2, pp. 179–195.
- Warwick, A. (1998) Exercising the student body: Mathematics and athleticism in Victorian Cambridge, in Science Incarnate: Historical Embodiments of Natural Knowledge, eds Lawrence, C. and Shapin, S., The University of Chicago Press, Chicago, London, pp. 288–326.
- Venn, J. (1880) On the forms of logical proposition, Mind, vol. 5, no. 19, pp. 336–349.
- Moktefi, A. (2018) Carroll diagrams: Design and manipulation, in Diagrammatic Representation and Inference, 10th International Conference, Diagrams 2018, Edinburgh, UK, 18–22 June 2018, eds Chapman, P., Stapleton, G., Moktefi, A., Perez-Kriz, S. and Bellucci, F., Springer, pp. 32–35.
- Warwick, A. (2003) Masters of Theory: Cambridge and the Rise of Mathematical Physics, University of Chicago Press, Chicago, London.
Reproduced from Mathematics Today, April 2023
Download the article, The Venn Behind the Diagram (pdf)