The HIV-AIDS epidemic is without doubt one of the biggest health disasters of recent times, responsible for over 35 million deaths worldwide, and around 25,000 in the UK. On 1 December 2018, we mark World AIDS day’s 30th anniversary. Thirty years ago, HIV was considered a disease of gay men and drug users. Since then, HIV infection has changed from a death sentence to a manageable condition that, with the right treatment, hardly alters life expectancy.
Tackling HIV-AIDS has required multi-disciplinary effort, and mathematical modelling played a central role. AIDS presented new challenges for modelling, as a disease with a long and variable latency that took years or decades to progress. Theory was developed and refined, subjects merged and models have become more sophisticated and policy-focussed. The AIDS epidemic was a wake-up call for public health and a defining event for disease modelling of all types.
Thirty years ago, Graham Medley, Professor of Infectious Disease Modelling at the London School of Hygiene and Tropical Medicine, was a research assistant at Imperial College London. ‘We really didn’t know how important AIDS was. In about 1983 or 1984 there were the first indications of something but hardly anyone was dying of it. I did my PhD on worms. This was a distraction.’
Medley et al. presented ‘A Preliminary Study of the Transmission Dynamics of the Human Immunodeficiency Virus (HIV), the Causative Agent of AIDS’ at an IMA conference in 1986 [1]. It was one of the first models developed to understand the drivers behind the epidemic, particularly the role of sexual behaviour and the long incubation period.
At the time, most infectious disease models consisted of two or three differential equations. In a population of size  , the most basic infectious disease models describe the number of cases over time as a function of the number of cases
  , the number of susceptible individuals
  , and some parameters: the transmission rate between individuals
  , the number of contacts
  and the average incubation period
  :
:
(1) 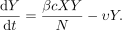
In this model, the number of infected individuals increases due to transmission from an infected individual to a susceptible individual (the first term on the right-hand side) and is depleted by the recovery of infected individuals (the second term). Such models were being used at the time to describe the rapid dynamics of childhood diseases, such as measles.
In the early stages of an epidemic, when the majority of people are not infected,  , the growth rate is approximately exponential. A fundamental quantity in disease modelling is the basic reproduction number or
  (‘R nought’), which is defined as the number of secondary cases produced by an average infectious person. In this formulation, the average person is infected for units of time and they are generating new cases with rate
  . Therefore, is
  . Rewriting equation (1) in terms of and integrating we get:
(2) 
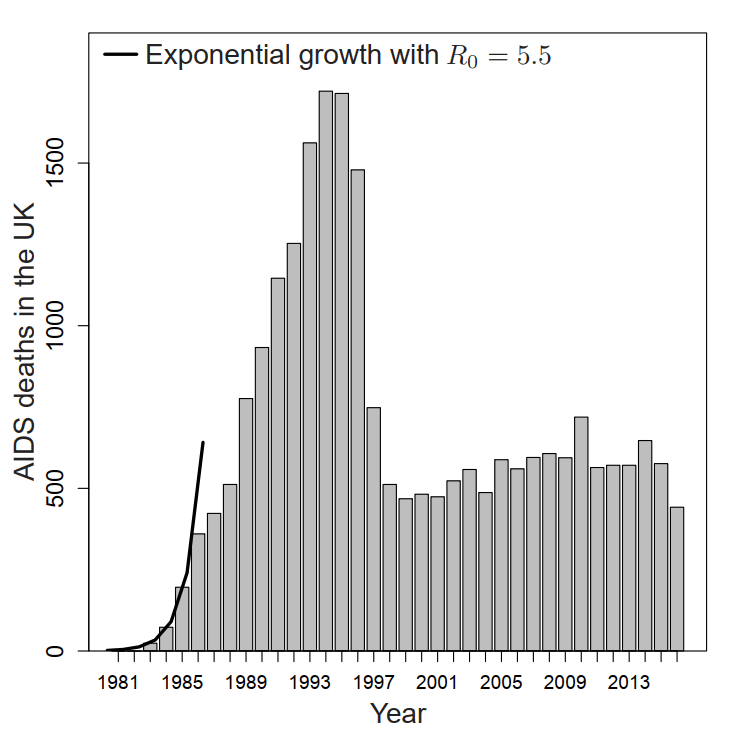
Assuming exponential growth, Figure 1 shows how was estimated to lie between 5 and 6 during the early stages of the AIDS epidemic in the UK.
It was clear that a simple model would not be able to capture the social and biological processes driving the HIV epidemic. The first epidemiological studies of HIV and AIDS found that a high number of sexual partners predisposed an individual to infection [2]. One study reported that men with 100 or more sexual partners a year increased their odds of infection by over 50, compared to men with fewer than 5 partners a year [3].
Medley and colleagues incorporated sexual behaviour into their model by dividing the population into subgroups according to number of sexual partners. Now  and
and  are the number of susceptible and infected individuals with
  partners. The equation for the number of cases over time became:
(3) 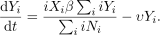
The rate of acquiring infection is (the number of partners) multiplied by a weighted sum of the proportion of infected individuals in each group. The complexity of this new model was unusual and meant that it had to be run on the mainframe at Imperial College.
Medley’s collaborator Robert May showed how the growth rate of the epidemic based on equation (3) depends on the distribution of numbers of sexual partners, rather than the mean number of partners alone. Medley explained: ‘Equation 5.5 in the paper was important: we showed that the early growth rate depended on the mean number of sexual partners  plus the variance
  divided by the mean.’ Now, epidemic growth depended on the constant
  , defined as:

As  , this meant that the epidemic would grow more quickly and be more challenging to control in populations with heterogeneous behaviour than in populations with relatively similar behaviour. With no data available on sexual behaviour, Medley and colleagues used unpublished data gathered from interviews of a convenience sample of AIDS patients in London to provide an estimate of the distribution in the number of sexual partners per person.
Another source of uncertainty in the early stages of the epidemic was the underlying number of people infected with HIV, given the number of AIDS cases. A study of gay men in San Francisco found over 70% of men had HIV antibodies. It seemed inconceivable that all of those people would die of AIDS. Indeed in their paper, Medley and colleagues initially assumed that only 10 to 30% of HIV positive people would go on to develop AIDS.
The relationship between HIV prevalence and AIDS cases is determined by the incubation period, or the time between infection with HIV and the development of AIDS. However, identifying a precise date of exposure for the vast majority of AIDS cases was difficult. Exceptions to this were people infected via contaminated blood transfusions. Medley and colleagues used data from 297 transfusion patients in the United States, who had had transfusions between 1978 and 1986 and were diagnosed with AIDS between 1982 and 1986 [4].
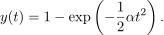
Standard disease models include a constant risk, independent of time, of developing AIDS once infected, leading to an exponentially distributed incubation period. Using the transfusion data, Medley and colleagues showed that the probability of progression from HIV to AIDS increased linearly with time since infection,  for some parameter
  . Under this assumption the proportion of HIV-infected individuals with AIDS,
  , is given by a Weibull distribution:
Once they had established this relationship between HIV prevalence and AIDS, it was clear that there was an ‘iceberg’ effect and that there were many undiagnosed HIV cases. Medley concludes: ‘When seropositivity data started to appear, it confirmed what we had thought to be true’: that this was the start of what was going to be a major health disaster.
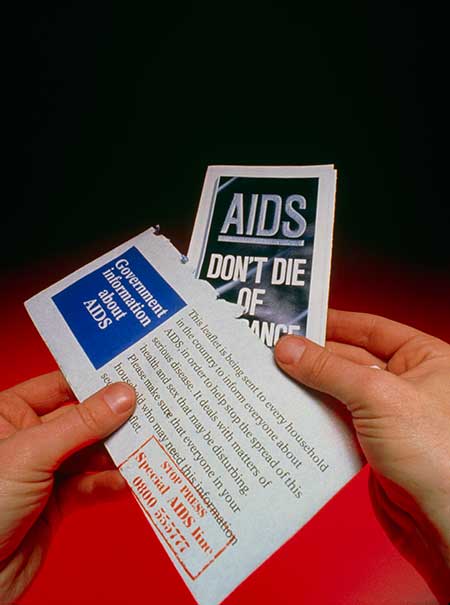
The modelling work of Medley and colleagues was highly influential in the UK government response. The ‘Don’t die of Ignorance’ campaign was launched in 1987 and a leaflet was sent to every household in the country. There were television campaigns about the Iceberg Effect (watch online: www.youtube.com/watch?v=yVggWZuFApI). Secondly, needle exchange schemes were started to reduce the impact of risky practices.
HIV modelling is still an active area of research [5]. Models have become more policy-focussed by including socially defined groups, such as sex workers or drug users, rather than delineating people by their number of sexual partners, which is notoriously difficult to record accurately. Mixing rates between groups are quantified using surveys such as the National Survey of Sexual Attitudes and Lifestyles (Natsal), established to inform the prediction of HIV transmission in Britain [6]. Models now include treatment and the history of treatment. With appropriate treatment, the proportion of people with HIV who develop AIDS is around 10%.
It is curious why it took several years for the first models of HIV to be developed: now, models of new diseases are published within weeks or months of the first cases being reported. Medley surmises: ‘There was not the health infrastructure that there is now. Now, largely due to the HIV epidemic, a huge amount of resources go into viral surveillance in sub-Saharan Africa to catch things early. If the 2015 Ebola epidemic had happened 40 years ago we wouldn’t have known about for much longer and it would have been even more devastating.’
Ellen Brooks-Pollock FIMA
University of Bristol
Acknowledgement
Many thanks to Graham Medley for discussing his work and commenting on this article.
‘Urban Maths’ cartoonist: Adrian Metcalfe – www.thisisfruittree.com
References
- Anderson, R.M., Medley, G.F., May, R.M. and Johnson, A.M. (1986) A preliminary study of the transmission dynamics of the Human Immunodeficiency Virus (HIV), the causative agent of AIDS, Math. Med. Biol., vol. 3, pp. 229–263.
- Marmor, M., Laubenstein, L., William, D., et al. (1982) Risk factors for Kaposi’s sarcoma in homosexual men, Lancet, vol. 319, pp. 1083–1087.
- Moss, A.R., Osmond, D., Bacchetti, P., et al. (1987) Risk factors for AIDS and HIV seropositivity in homosexual men, Am. J. Epidemiol., vol. 125, pp. 1035–1047.
- Medley, G., Anderson, R., Cox, D. and Billard, L. (1987) Incubation period of AIDS in patients infected via blood transfusion, Nature, vol. 328, pp. 719–721.
- Childs, L.M., Abuelezam, N.N., Dye, C., et al. (2015) Modelling challenges in context: lessons from malaria, HIV, and tuberculosis, Epidemics, vol. 10, pp. 102–107.
- Mercer, C.H., Tanton, C., Prah, P., et al. (2013) Changes in sexual attitudes and lifestyles in Britain through the life course and over time: findings from the National Surveys of Sexual Attitudes and Lifestyles (Natsal), Lancet, vol. 382, pp. 1781–1794.
Reproduced from Mathematics Today, December 2018
Download the article, Urban Maths: World AIDS Day 2018 (pdf)