DNA recombination
The classical dogma in biology says that DNA stores information, which is transcribed into RNA and then translated by ribosomes into functional proteins. This general principle is a result of highly complex biomolecular interactions that reveal other parts of the puzzle. In the past couple of decades, it has become evident that RNA molecules of various sizes play essential roles in genetic regulation. In the words of Helen Pearson, John Mattick and Robert Pruitt: ‘In some cases, RNA may even pass information across generations – normally the sole preserve of DNA’ [1], while the discovery of alternative splicing shows that protein-coding regions from one part of the genome can combine with parts from another area, which can be hundreds of thousands of bases away.
Our understanding of biomolecular processes is at different levels, and mathematics has an essential role in this endeavour. One can consider biomolecules as information processing materials. RNA, DNA and proteins consist of sequences of units (nucleotides or amino acids), which can be described by letters and words. Many sequence-based algorithms, in particular those that provide fast DNA sequencing, use Eulerian cycles and paths within so-called de Bruijn graphs [2]. Bioinformatics has been successful in exploiting sequence-based algorithms for advancing biotechnology. However, biomolecules are intrinsically three dimensional and sequences alone do not come even close to describing biomolecular complexes and their actions. New ways in which RNA interacts with and regulates DNA are being discovered almost daily. These, for example, include RNA-templated DNA recombination [3], transcript RNA repairing double cuts in DNA [4] as well as the essential role of RNA in the CRISPR-Cas9 technology for precise gene editing; an important tool in gene therapy. Many of these processes can be understood only mathematically. For example, we cannot quite describe the shape of yet to be crystallised RNA–DNA complexes, including those formed during transcription as well as those formed when RNA serves as a template during DNA recombination; the topic of this article.
DNA recombination is ubiquitous in nature. For over 60 years, biologists have known that chromosomal DNA rearrangements on an evolutionary scale can lead to species-specific differentiation. In mammalian genomes, it has been observed that DNA recombination events are more prevalent within the same chromosome (intrachromosomal) than across different chromosomes [2]. Using graph theory approaches, molecules have been represented as cycles and paths. Evolutionary recombination events have also been modelled with double-cut-and-join operations, which represent recombination through cuts and joins of these cycles and paths. The number of such operations leading from one molecule to another can be taken as a genetic distance in an evolutionary analysis of the design of evolutionary trees [5].
On a developmental scale, DNA rearrangements can specify gene expression, most commonly involving DNA deletion, and these events occur even in humans [6]. For about a decade now, we have been studying RNA-guided DNA recombination using spatial graphs employing concepts from topological graph theory and knot theory.
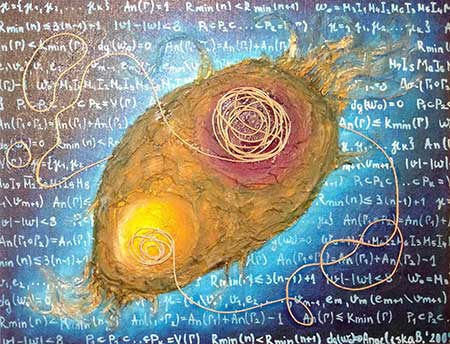
As is often the case in biology, a process can be studied best in an organism where it occurs frequently. For DNA recombination, such testing grounds are certain species of ciliated protozoa (or simply ciliates), which are single-cell organisms capable of the complex behaviour often associated with multi-cell organisms. Figure 1 shows an artist’s depiction of a ciliate.
Ciliates have a unique nuclear morphology and genetics. While most eukaryotic cells contain only one type of nucleus (sometimes in many copies), ciliate cells contain two functionally different types of nuclei: a somatic macronucleus (MAC), which is responsible for keeping the organism alive, and an archival germline micronucleus (MIC), which is mostly dormant and acts as storage. Ciliates are prevalent everywhere on our planet. Even relatively closely related species may have a vast evolutionary distance, and, roughly, can be as distant as an elephant and a cucumber. Ciliate species in the subclass {Stichotrichia} go through a massive genomic recombination during their development. Here we consider a species within this group, Oxytricha trifallax, whose macronuclear genome was recently sequenced. It has one of the most complex genomes known [7]. It has over 16,000 (nano)chromosomes with one to eight genes, and each chromosome can have hundreds or thousands of copies.
Under stressful conditions, two cells mate and produce two daughter cells. During this process, a massive genetic restructuring of one of the newly formed MICs transforms it into a new somatic MAC. MAC development includes extensive DNA processing and recombination, including the deletion of all so-called junk DNA by eliminating 90–98% of the MIC DNA. The deletion process eliminates segments, called internal eliminated sequences (IESs), that interrupt the coding regions of the genes. Each MAC gene in the MIC may appear in several segments, called macronuclear destined sequences (MDSs). Moreover, the order of these MDS segments can be permuted or inverted (i.e. rotated by 180°) in the MIC relative to the order of these segments in the MAC. As noted in [7], over 3000 genes are scrambled in the MIC of O. trifallax. The number of MDSs varies from 2 to over 100. Assembly of the new macronuclear nanochromosomes may require any combination of the following three processes: descrambling (permuting) of MDSs, inversion of MDSs and deletion of IESs. These restructuring events are the focus of our studies.
It has been observed that short DNA sequence repeats, called pointers, are present at the end of each  th MDS and at the beginning of the
  st MDS in the MIC. Only one copy is retained in the MAC after recombination. These short direct repeats suggest pointer-guided recombination, which in computer science is also known as a linked list. However, the pointer length (2–20 bp) is prone to frequent repetition within the genome, and a correct recombination must require additional information for proper DNA splicing at the pointer pair.
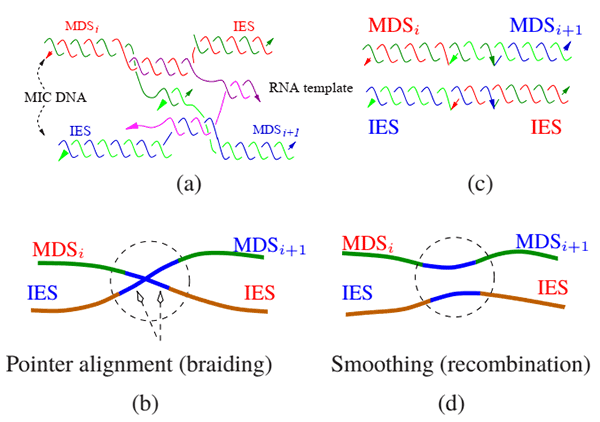
We proposed a model for RNA-templated DNA rearrangement in [8], which was experimentally confirmed by our collaborator, Laura Landweber at Columbia University in New York, and her lab [3]. The model describes DNA site-specific homologous recombination via pointers at the splice site. This RNA–DNA complex during recombination can be seen as topological braiding (Figures 2(a) and 2(b)), which we represent as a rigid four-valent vertex of a graph. The recombination event itself (Figure 2(c)) is represented as a smoothing of the vertex, as depicted in Figure 2(d).
Theoretical representation of the rearrangement
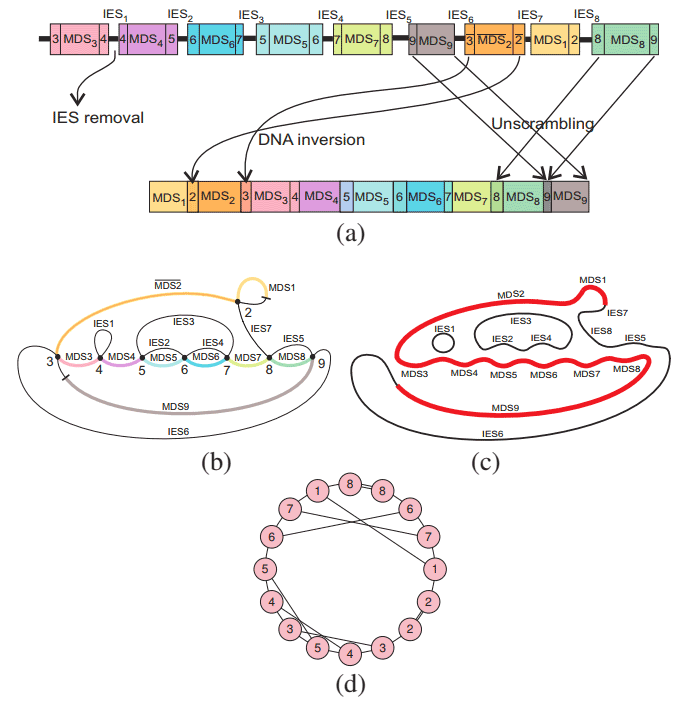
We developed a theoretical model to describe the process of rearrangement. The model uses spatial graphs with rigid vertices [9]. To these graphs we also associate double occurrence words (DOW) [10], and their corresponding chord diagrams [11]. The spatial graph, called an assembly graph, with 4-valent rigid vertices, with or without end points represents one or more MIC loci. Figure 3(b) is a schematic representation of the MDS-IES structure of the scrambled gene in Figure 3(a). A MIC locus is represented by an Eulerian transverse path in which consecutive edges, corresponding to an MDS-IES alternating sequence, go straight through the vertices. Each four-valent vertex represents a pointer alignment (Figure 2(b)). Such spatial graphs, like that in Figure 3(b), can be seen as a representation of the DNA during recombination.
A simultaneous smoothing of the vertices corresponds to DNA recombination at each pointer site (Figure 3(c)), and we have proven that for every graph representing a scrambled gene, such smoothings always produces rearranged genes in the correct order. Further, we have observed that there is always an embedding of these graphs in  , such that the smoothing process produces an unknotted molecule, which is preferred for a well-functioning gene. As seen in Figure 3(c), the model suggests that recombination events also produce cyclic molecules containing joint excised segments. Recent lab experiments [12] indicate that such molecules might be part of an intermediate process during MAC development. If indeed shedding of cyclic molecules during recombination appears on a large scale, the process may be yet another reason to study O. trifallax through our model, because the production of extra-chromosomal circular DNA (eccDNA) during regulatory processes has been observed in other species, including several human cell types [14].
 symbols is an arrangement of
  points on a circle labelled by the letters of the word in their order of appearance. Chords (line segments) connect pairs of points labelled by the same letter. Chord diagrams are used extensively in many branches of mathematics, such as combinatorics, graph and knot theory (see, for example, [16, 17]), as well as in biology (e.g. [18, 19]). The corresponding assembly graph of the Actin I gene shown in Figure 3(a) is depicted in (b). A DOW representing the graph is 3445675678932289, which is obtained by reading the vertices along the path passing straight through each vertex. Its chord diagram is represented in Figure 3(d).
Discovering patterns in the scrambled genes
The main goal of our work is to understand RNA-mediated DNA recombination, to identify the main players and to unravel the RNA–DNA complex and the intermediate steps during the rearrangements. As mentioned, our model organism O. trifallax has the highest known level of natural genome editing. However, before we could start developing a precise experimental design for detecting the intermediate steps in the process, a better understanding of O. trifallax‘s genome was needed. It turned out that this task was both challenging and surprising.
Intragene scrambling: odd–even interleaving
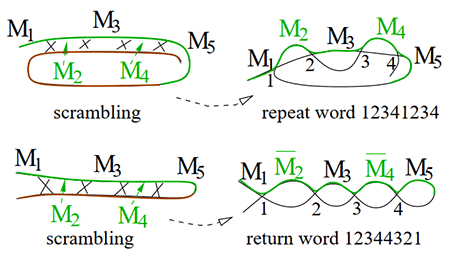
After sequencing both the O. trifallax MIC germline genome and its MAC somatic genome, we studied the data represented in the spatial graphs of the scrambled genes. We observed that a majority of the scrambled genes contain a pattern in which clusters of consecutive even-numbered MDSs are separated from clusters of consecutive odd-numbered MDSs. We found that there are odd–even patterns in over 80% of all scrambled Oxytricha genes [20]. In the corresponding DOWs, odd–even patterns are represented by subwords of the form  and
and  , where
  is a positive-length word,
  is the reverse of and
  is a (possibly empty) word. We call
  a repeat word in
  , and a
  a return word in
  . These patterns appear as braided parallel segments in the associated assembly graph, as depicted in Figure 4.
 and
and  with their repeat and return words.
Repeat and return patterns can appear nested. For example, in 12234341, the return word 1221 is interrupted by the repeat word 3434. We studied the depth of the nesting patterns (the pattern index) of repeat–return patterns and applied it in a genome-wide study to all MIC contigs (long DNA segments obtained by throughput sequencing) of O. trifallax. We found that 97% of the MIC contigs have a nested pattern index depth of 5 or less [20]. We defined a distance measure between patterns through the pattern index and showed that for DOWs, this index can be computed [21]. Pattern reduction also indicates possible steps for unscrambling the genes. Collaborators at Landweber’s lab are undertaking experimental analysis designed to identify vital intermediate DNA segments that arise during MAC development. Such intermediate molecules may help in deciphering the rearrangement process.
Intergene scrambling: nested like a Russian doll
The scrambled genes in the MIC were just a small piece of the enigma. In the MIC, an IES between two MDSs of one MAC gene can contain multiple MDSs of another MAC gene, or even several other MAC genes [7]. We discovered extraordinary MIC loci that contain up to five layers of nested genes, with all the segments for one MAC gene completely embedded in the IES of another MAC locus, whose MDSs themselves are completely embedded within the IES of yet another locus, and so on (Figure 5). In many other cases across the genome, all of the MDSs for one MAC gene reside within a single IES of another.
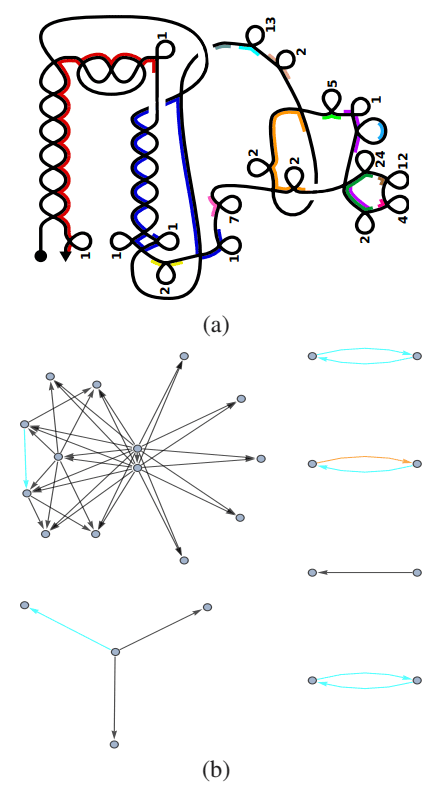
We can measure the degree of embedding within genes with an interleaving depth index (IDI) that recursively counts the nested appearances. For example, in Figure 5(a), the assembly graph represents several, distinctly colour-coded, genes. The IDI of the red gene is 4. By calculating the IDIs for all MIC segments, we found that over 60% of the interleaving genes are scrambled [22].
MIC segments containing interleaving or intersecting MAC genes can be further represented as directed and coloured graphs, called intergene scrambling pattern (ISP) graphs. The vertices of an ISP graph represent MAC genes and the arcs between two vertices represent interleaving or overlapping MDS segments between the corresponding MAC genes (Figure 5(b)). The set of graphs associated with the whole O. trifallax genome identified 283 isomorphism classes. Several isomorphism classes included cliques (complete graphs) of up to six vertices, implying that MDSs of six MAC genes mutually interleave or overlap. These graphs also contain star-like structures, which are for genes with a high IDI.
The current experiments being conducted at Landweber’s laboratory, Columbia University are testing the hypothesis that during MAC development, the most scrambled and interwoven structures are processed last. An alternative hypothesis would be that interwoven structures are unscrambled earlier, which would free the respective MDSs to recombine with other MDSs for the correct MAC locus. Given many possibilities, we are eager to learn more about the rearrangement pathways from experimental data.
Looking ahead
Our studies have unveiled the patterns of scrambled gene segments and their extent in the genome of O. trifallax. Odd–even repeat and return patterns account for 82% of the scrambled MAC genes and almost all scrambled MIC segments (97%) are nested appearances of repeat–return words, which suggests that the scrambled patterns (or rearrangements) are not random and there may be preferred stages of unscrambling. Hence, we need to develop models that address the rearrangement processes for these patterns. Moreover, experimental findings of intermediate molecules that appear during the rearrangement process may reveal new and unexpected results. The complex scrambling of the genes in the MIC was exposed only after detailed studies of the newly sequenced genome.
It could be argued that the discovery of RNA-guided precise gene editing is one of the scientific revolutions of our era. Understanding template-guided genome rearrangement will have a further impact on society. As a natural phenomenon, when it is misguided, DNA rearrangement can lead to diseases, for example certain forms of cancer are a result of DNA recombination gone awry. However, when harnessed, template-guided recombination could be the next generation of tools for genome editing.
Nataša Jonoska
University of South Florida
Acknowledgements
The experimental results were obtained in Landweber’s laboratory at Columbia University in New York. This research was (partially) supported by National Science Foundation (NSF) grants (DMS-1800443/1764366), the Southeast Center for Mathematics and Biology, the NSF-Simons Research Center for Mathematics of Complex Biological Systems under an NSF grant (DMS-1764406) and a Simons Foundation grant (594594).
References
- Pearson, H., Mattick, J. and Pruitt, R. (2006) Genetics: what is a gene? Nature, vol. 441, pp. 398–401.
- Pevzner, P. and Tesler, G. (2003) Genome rearrangements in mammalian evolution: lessons from human and mouse genomes, Genome Res., vol. 13, pp. 37–45.
- Nowacki, M., et al. (2008) RNA-mediated epigenetic programming of a genome-rearrangement pathway, Nature, vol. 451, p. 153.
- Keskin, H., et al. (2014) Transcript-RNA-templated DNA recombination and repair, Nature, vol. 515, pp. 436–439.
- Pevzner, P.A., Tang, H. and Waterman, M.S. (2001) An Eulerian path approach to DNA fragment assembly, Proc. Natl. Acad. Sci., vol. 98, pp. 9748–9753.
- Stephens, P.J., et al. (2011) Massive genomic rearrangement acquired in a single catastrophic event during cancer development, Cell, vol. 144, pp. 27–40.
- Chen, X., et al. (2014) The architecture of a scrambled genome reveals massive levels of genomic rearrangement during development, Cell, vol. 158, pp. 1187–1198.
- Angeleska, A., et al. (2007) RNA-guided DNA assembly, J. Theor. Biol, vol. 248, pp. 706–720.
- Angeleska, A., Jonoska, N. and Saito, M. (2009) DNA recombination through assembly graphs, Discrete Appl. Math., vol. 157, pp. 3020–3037.
- Burns, J., et al. (2013) Four-regular graphs with rigid vertices associated to DNA recombination, Discrete Appl. Math., vol. 161, pp. 1378–1394.
- Burns, J., Jonoska, N. and Saito, M. (2015) Genus ranges of chord diagrams, J. Knot Theor. Ramif., vol. 24, p. 1550022.
- Yerlici, V.T. et al. (2019) Programmed genome rearrangements in Oxytricha produce transcriptionally active extrachromosomal circular DNA, Nucleic Acids Res., gkz725.
- Jonoska, N. and Saito, M. (2010) DNA rearrangements through spatial graphs, in Programs, Proofs, Processes, CiE 2010, Lecture Notes in Computer Science, (eds Ferreira F., Löwe B., Mayordomo E., Mendes Gomes L.), vol. 6158, Springer, Berlin, Heidelberg, doi.org/10.1007/978-3-642-13962-8_24.
- Shoura, M.J., et al. (2017) Intricate and cell type-specific populations of endogenous circular DNA (eccDNA) in Caenorhabditis elegans and Homo sapiens, G3: Genes, Genomes, Genet., vol. 7, pp. 3295–3303.
- Turaev, V. (2007) Lectures on topology of words, Jpn. J. Math., vol. 2, pp. 1–39.
- Andersen, J.E., et al. (2010) Linear chord diagrams on two intervals, arxiv.org/pdf/1010.5857v1.pdf.
- Birman, J.S. and Trapp, R. (1998) Braided chord diagrams, J. Knot Theory Ramifications, vol. 7, pp. 1–22.
- Campbell, P.J., et al., (2008) Identification of somatically acquired rearrangements in cancer using genome-wide massively parallel paired-end sequencing, Nat. Genet., vol. 40, pp. 722–729.
- Hampton, O.A., et al. (2009) A sequence-level map of chromosomal breakpoints in the MCF-7 breast cancer cell line yields insights into the evolution of a cancer genome, Genome Res., vol. 19, pp. 167–177.
- Burns, J., et al. (2016) Recurring patterns among scrambled genes in the encrypted genome of the ciliate Oxytricha trifallax, J. Theor. Biol., vol. 410, pp. 171–180.
- Jonoska, N., Nabergall, L. and Saito, M. (2017) Patterns and distances in words related to DNA rearrangement, Fundamenta Informaticae, vol. 154, pp. 225–238.
- Braun, J., et al. (2018) Russian doll genes and complex chromosome rearrangements in Oxytricha trifallax, G3: Genes, Genomes, Genet., vol. 8, pp. 1669–1674.
Reproduced from Mathematics Today, October 2019
Download the article, Discovering Patterns in a Scrambled Genome (pdf)