Insurers are risk-takers, accepting premiums to cover unknown, but potentially very large, future insured events; insurers have to balance complex theoretical mathematics with commercial considerations; they must be profitable but yet offer commercially acceptable premiums. In particular, in the car insurance market insurers have to take into account the possibility of selling the customer other products, real time pricing (as a result of price comparison websites) and new EU-wide Solvency II rules for capital management.
Introduction
In September 2014 the Competition and Markets Authority (CMA) decided that exclusive pricing deals between motor insurers and price comparison websites (e.g. gocompare.com, comparethemarket.com) should be banned. The CMA believes that many of the 26 million private motorists in the UK are paying too much for their car insurance. This article looks at how insurers use mathematical methods to set premiums for car insurance and considers whether, in fact, customers are paying too much.
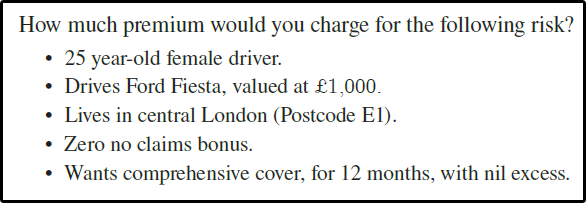
The typical car insurance problem is shown in Figure 1.
Background
Car insurance is mostly mandatory; the Road Traffic Act (RTA) requires the driver of a motor vehicle to have at least third party insurance to drive a vehicle on a public highway, with two exceptions:
- If the owner of the vehicle is a public body (e.g. a local authority, the police or the NHS) or
- If the owner of the vehicle deposits £500,000 with HM Treasury (RTA, paragraph 144).
Car insurance policies are generally 12 months’ duration although they can also be sold for shorter terms such as 1 month or 3 months, most typically to taxi drivers.
Once the insured has paid the premium the insurer cannot cancel the policy before the end of its term unless the insurer identifies some element of non-disclosure (e.g. incorrect or fraudulent information given). Mathematically, this means that the insurer must pay all of the claims throughout the policy term, no matter how many claims there are or how much they cost. The largest UK motor insurance claim to date arose out of the Selby rail crash in 2001; this event, involving just a single vehicle, cost the insurance company £50 m due to the extensive damage to the train line, the train tracks and compensation for the ten fatalities. Therefore, each time an insurer sells a motor insurance policy they are putting themselves at risk of, potentially, multiple claims of this type arising during the policy term. Of course, the probability of such a large event for any specific driver is very small; however, as we shall see later in this article this small probability cannot be ignored.
Simple Premium Equation
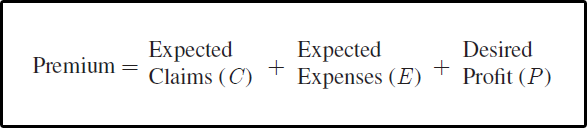
In simple terms the premium charged by the insurance company equals its claims, its expenses and its profit. There are also some further small complications such as investment income, corporation tax and insurance premium tax (IPT) which we will ignore for the purposes of this article.
This problem is typically solved as a multivariate problem, that
is to estimate the claim frequency ( ) and claim severity (
 ) for
) for
each combination of factors (such as age of driver, gender of driver,
home postcode etc.) based primarily on the past claims data for
similar insureds. The expected claims ( ) are then
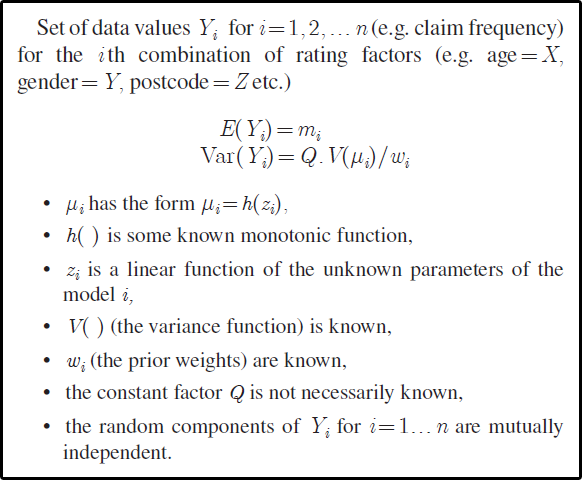
The advent of significant computing power in the 1980s led to the widespread use of Generalised Linear Models (GLMs). A seminal Institute of Actuaries paper [1] in 1992 set out the typical model structure shown in Figure 3.
In simple terms, the typical issues with this approach are as follows:
- We only have very limited data about the ‘behaviour’/claims history of previous identical (or similar) insureds.
- The policy may cover very large claims, the size of which have not occurred before for that type of insured.
- We are trying to estimate the future behaviour (claims) of customers, not their past behaviour (claims).
- There are millions of combinations of factors.
Having a modelling framework (and a fast computer!) is all very well, but what to model as predictive factors for claim frequencies and claim severities? When car insurance policies are sold, certain information is collected at the point of sale e.g. age of driver, make/model of car, number of miles driven, home postcode, number of claim-free years etc. But some further thought is required before hasty modelling.
Some of these factors may be highly correlated (e.g. young drivers are unlikely to have a high number of claim-free years) whereas some factors may be proxies for ‘true’ predictive factors which have not been collected (e.g. home postcode may be a proxy for affluence, i.e. wealthier people may be less inclined to claim for small amounts – i.e. a lower claim frequency – whereas less affluent people may be more inclined to ‘get value for money’ from their policy, e.g. by claiming for every scrape, dent, etc).
In addition, some factors are virtually (or totally) prohibited from use by Discrimination laws e.g. race, religion, sexual orientation, disabilities etc. Indeed in 2012 the European Union (EU) ruled to ban the use of gender as a rating factor, i.e. there can be no difference between premiums charged to a man and a woman driving the same car in the same postcode etc. So the parameters used in the model can change over time.
Over time, some car insurers have introduced more socio-economic rating factors, by asking questions such as marital status, number (and ages) of children, number of cars in household, number of properties owned and whether you are a home owner or a tenant. Of course, unless the insurers had been collecting this information historically at the point of sale, then there is no historic data classified into these categories! In these cases, insurers have to ‘back-fit’ their historic data into these new categories by using other information sources such as census information and wider socio-economic classification databases.
Conversely, some insurers have taken the opposite approach; they want to speed up the sales process by significantly reducing the number of questions. In a real-life case, one corporate insurer client of mine wanted to ask only two questions at the point of sale (one of which was ‘what is your home postcode?’, the other question we will leave you to think about!), before offering you a premium for your car insurance. Clearly, in this case, there exists significant potential for cross-subsidies in the premiums, and hence premiums which are out of line with other insurers, leading to ‘too many’ or ‘too few’ policies being sold.
Of course, the ‘real’ predictive factors are unknown; accidents are often caused by complex human interactions which may not be predictable using current data. There is even talk of genetic testing one day identifying a human ‘risk-taking’ gene, thus ‘predicting’ who is likely to be a ‘good’ or ‘bad’ driver; such tests could become a requirement for a discount on your car insurance although this is certainly many years, perhaps decades, into the future.
So there is uncertainty about the predictive power of any GLM for car insurance; this uncertainty is often modelled using simulation techniques, parameter confidence intervals, bootstrapping and Bayesian methods, which are all used with the aim of attempting to quantify the uncertainty, and hence, charging an appropriate premium to reflect the level of uncertainty.
As well as the above pure constraints, there are also some commercial considerations which need to be reflected in the mathematical modelling:
- The premiums charged should be ‘unique’ for each individual (each parameter combination e.g. age, gender, car etc.).
- The premium should be locally smooth across the parameter boundaries (e.g. as the insured moves from one age to the next the premium should change in a smooth fashion).
Once the multivariate model has derived the unsmoothed frequency and severity for all combinations of factors these then need to be smoothed, interpolated and inflation-adjusted to develop forecasts of the claims frequency and severity for each combination of rating factors for the next twelve months (i.e. the policy period to be covered).
Expenses
An insurer needs to cover the costs incurred in running its corporate operations, for example:
- its call centre,
- its IT system (policy and claim records, accounting, premium collection etc.),
- claims handling staff,
- office costs (office rent, light, heat),
- issuing and posting paperwork,
- generating quotes for price comparison websites.
Using methods such as activity based costing (ABC) the insurer can derive its fixed and variable costs, broadly divided into:
- fixed per policy costs: costs incurred in selling a single policy e.g. issuing quotes, policy documents, premium collection.
- fixed per claim costs: the costs involved in processing each claim e.g. the IT costs of setting up a new electronic claims file, issuing claim forms etc.
- variable costs: staff costs incurred in handling claims, increasing with the complexity (cost) of the claim.
Thus, the expenses expected to be incurred by the insurer over the policy period for each policy ( ) are dependent upon the frequency and severity of claims expected to be produced by that policy, i.e. the multivariate model is required to estimate not just the insured’s expected future claims () but also the insured’s expected future expenses ().
Profit
The insurer’s shareholders are in business to make a profit, that is generating more cash income than cash outgo. Typically shareholders require a return on their capital commensurate with the risk of loss. This then raises two further questions:
- How much capital is required to sell a single insurance policy?
- What return on that capital should the shareholders require as a function of the ‘riskiness’ of that policy?
Capital Requirements
Solvency II, an EU-wide legal framework for insurance companies, is currently being implemented and will take full force from 2016. It requires insurers to have sufficient net assets to ensure a less than 0.5% chance of insolvency over the next 12 months (i.e. the insurer can broadly withstand a 1/200 year event). There is a very prescriptive basis (running to several hundred pages) as to how to calculate this but, essentially, the insurer must set aside reserves to cover ‘the average of the outcomes of all possible scenarios, weighted according to their respective probabilities’ [2]. Thus, the largest UK motor insurance claim noted above of £50 m cannot be ignored as a ‘one-off’; instead its probability of future occurrence must be estimated and probability-weighted reserves held.
In addition to these reserves, it must hold sufficient capital (the solvency margin (SM)) to ensure that it can withstand not just the average outcome as above, but the outcome at the 99.5% percentile of the joint distribution of the behaviour of its assets and liabilities. For all but the smallest insurers the joint distribution of assets and liabilities is extremely complex.
Copulas are of immense value in estimating the overall joint distributions; they are a simpler mathematical form of multi-variate probability distributions and contain the whole information about the variables’ dependency structure (see Figure 4).
In broad terms, the capital required for a single car insurance policy is roughly 75% of the premium. Thus, a policy with a premium of £1,000 requires capital of c. £750 to satisfy the regulatory authorities (in the UK the Prudential Regulation Authority (PRA)) that the insurer has at least a 99.5% probability of paying whatever claims might emerge from that policy.
The SM is subject to an absolute minimum (floor) of c. £3 m. Thus an insurer whose total annual premiums are c. £100 m would require shareholder capital of c. £75 m (i.e. c. 75% of premiums); a very small insurer with total annual premiums of only £1 m would require shareholder capital of c. £3 m (i.e. the absolute floor, c. 300% of premiums). In other words, very small insurers are considered more risky, due to their reduced diversification of risk, and therefore require a higher amount of capital, relative to premium volume.
Return on Capital
Once this overall solvency margin (SM) has been calculated it can then be allocated to each individual policy based on the ‘riskiness’ of that policy, broadly taken as the expected variance of the joint frequency and severity distribution of that policy, according to the multivariate model derived above.
The shareholders require a return on their capital (of c. £750 for a £1,000 premium), commensurate with the ‘riskiness’ of that policy.
Typically a shareholder would require a return of perhaps a risk-free rate of say 2% (current short term gilt yields) with an addition of say:
- 3% for ‘low risk’ drivers
- 8% for ‘medium risk’ drivers
- 13% for ‘high risk’ drivers (perhaps young drivers or high performance cars).
Thus, for the example £1,000 premium above, if the insured was a ‘medium risk’ driver, the required shareholder return would be 10% (2% + 8%) of £750 i.e. a £75 premium loading to cover the shareholders’ required profits, taking the premium to say c. £1,075, perhaps rounded up to c. £1,100.
League Tables
Insurance companies do not operate in a vacuum. In recent years price comparison websites (e.g. gocompare.com, comparethemarket.com) have enabled customers to compare prices from numerous insurers at the same time.
An insurer will not only want to generate sufficient premium to pay for its expected claims, expenses and shareholder profits, it will also want to occur in a specific position in a price comparison website’s ‘league table’ to control business volumes at different levels of ‘riskiness’ relative to its shareholders’ requirements and capital position.
If the example premium of £1,100 above is substantially lower than any of its competitors, the insurer may take the view that this raises questions over the robustness of its premium estimates (e.g. the quality/accuracy of its data, models, assumptions etc.). It may not want to be significantly out of line with other insurers, as this may give rise to excessive numbers of policies being sold at a price which looks ‘too low’.
Conversely, an insurer may wish to ‘price itself out of the market’ by not wishing to be competitive for certain risks (e.g. young drivers or high performance cars). It does this by either adding additional return on capital requirement for its shareholders or adding a tactical profit component to determine where it wishes to be in the league tables. This will be determined not just by what other insurers are quoting, but also how confident the insurer is at cross-selling other products.
For example a typical car insurance quotation comes with offers to sell you many other types of insurance, such as home insurance, breakdown insurance, legal expenses insurance etc. These insurance products are highly profitable. An insurer will therefore usually offer a very competitive (mandatory) car insurance quotation in the hope that you will buy other (non-mandatory) insurances to make up the profit difference.
At renewal, an insurer may not want to offer you a competitive price if your take-up of their other (more profitable) insurance products has not been high enough to turn you into a profitable customer overall. Thus insurer ‘price-matching’ is only a rewarding strategy if the customer is likely to generate profits for the insurer with other products. Similarly, companies like Tesco often offer car insurance discounts for their clubcard members, not necessarily because they are better drivers, but because those customers generate profits elsewhere within Tesco (e.g. in the retail stores, banking products etc.).
Thus car insurance pricing requires a complex commercial view of the overall expected profitability of that customer across all products and services bought (or expected to be bought) by that customer (‘customer lifetime value’ pricing).
Actual Premiums
In our example above (see Figure 1) typical premiums would be £1,400 – £6,000, with an average of c. £2,500, comprised of perhaps:
- Expected claim frequency: 30% (cheapest price of £1,400 probably assumes 25%).
- Expected severity: £6,000 (cheapest price probably assumes £5,500).
- Thus expected annual claims cost (C ) of: c. £1,800 (cheapest price probably £1,100 = c. 25%
 £5,500).
 - Expenses loading (E ): c. £300.
- Thus Nil-profit price: £2,100 (cheapest price £1,400 = £1,100 + £300).
- Capital required: c. £1,600 (75%).
- Required profit (P ): c. £300 (c. 15%: high risk, due to combination of postcode and young driver).
- Other allowances (investment income, tax, IPT): £100 (not covered in this article).
- Total realistic price (C + E + P ): c. £2,500 (= average price quoted).
- The premium would be the same for a male driver.
The wide variation of £1,400–£6,000 between the 30 to 40 insurers (out of a total market of c. 120 UK motor insurers) who quoted for this risk (all having been given the same information at the same time) reflects the use of different multivariate models, different expense considerations, different classification of this as a low, medium or high risk (and therefore different required returns on capital for the individual insurers’ shareholders) and different expected customer lifetime value considerations. A majority of the insurers would not quote due to the ‘high risk’ nature of the risk (combination of inner London postcode and young driver).
However, by far the biggest difference in price is usually the value of the tactical profit component; some insurers want to be the market leader (the cheapest: large negative tactical profit) in the hope that they will be able to cross-sell you other insurance products. Other insurers, with the highest premiums (large positive tactical profit), do not want to be competitive for that type of risk (in this case an inner London postcode with a high propensity for theft).
The cheapest quotes are usually from insurers who are offering a loss-making product in the hope of recouping that profit from cross-selling other products.
Summary
Insurers are risk-takers, accepting premiums to cover unknown, but potentially very large, future insured events. Insurers have to balance theoretical mathematics with commercial considerations; they must be profitable but yet offer commercially acceptable premiums whilst at the same time satisfying minimum regulatory capital requirements.
So ‘are you paying too much for your car insurance?’. Probably not. In today’s world of real-time pricing, published league tables, cut-throat competition and retailers with huge amounts of customer data offering loyalty scheme discounts, car insurers usually make profits from cross-selling other products and services, not from the car insurance product itself.
John Birkenhead CMath FIMA
HJC Actuarial Consulting Limited
About the Author
John Birkenhead is an independent consulting actuary with 25 years’ experience of commercial insurance matters. He qualified as a Fellow of the Institute of Actuaries in the UK in 1995. Previously a Partner in a global actuarial consultancy, John set up his own independent actuarial consultancy in 2003, see www.johnbirkenhead.net.
Note
This article is based on the best talk, as voted for by delegates, at the IMA’s Early Career Mathematicians (ECM) Autumn 2014 conference.
References
Brockman, MJ and Wright TS (1992) Statistical Motor Rating – Making Effective Use of Your Data, Journal of Institute of Actuaries, vol. 119, no. 3, pp. 457–543.
European Insurance and Occupational Pensions Authority (2014) Technical Specification for the Preparatory Phase, V.2.2.1. ‘Methodology for the calculation of best estimate.’ Available via https://eiopa.europa.eu/
Reproduced from Mathematics Today, February 2015
Download the article, Are You Paying Too Much for Your Car Insurance? (pdf)