
Diversity Survey
Introduction
We carried out a diversity survey in March 2019 and were delighted to receive responses from 26% of the membership base, higher than the industry standard of around 15%.
“We would like to say thank you to all those who participated!”
Your responses help us to continue our ongoing work on diversity and inclusion. The data collected was anonymous and confidential and will only be used to address any identified issues. Please note that this report is based on the data from March 2019 and that the comparisons to other institute reports are based on the reports from the quoted references (which might be earlier than 2019 but were the most recent available for those at the time of writing).
Alan Peacock, IMA Assistant Director, and Gemma Reeves, IMA services Officer, reported on initial finding in the October 2019 issue of Mathematics Today. This webpage gives further details and comparisons against published reports from similar Institutes and National data1.
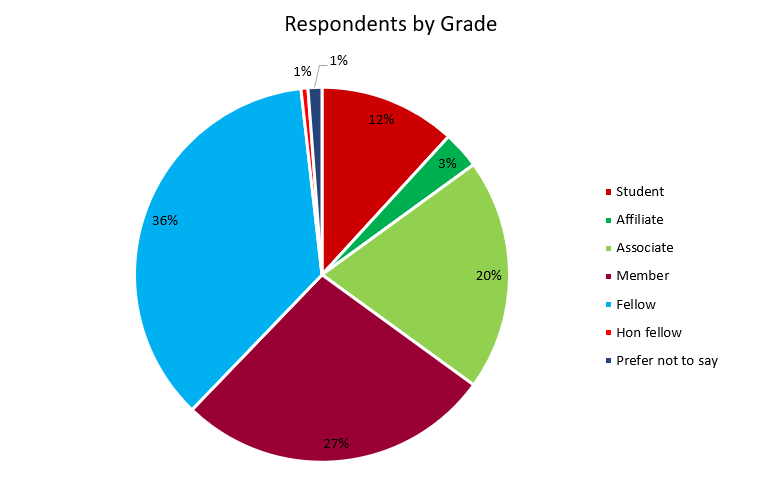
We had responses from all grades, see Figure 1, with the highest percentage coming from our Fellows, reassuring us that D&I is considered important at all levels of membership.
“We were pleased to see a healthy engagement with the survey by our Student members, 12% of respondents, which is significantly higher than the actual membership percentage of 8%.”
Gender
In terms of gender of respondents, see Figure 2, 75% were male, 24% were female, 0.6% identified as other and the remaining respondents preferred not to say.
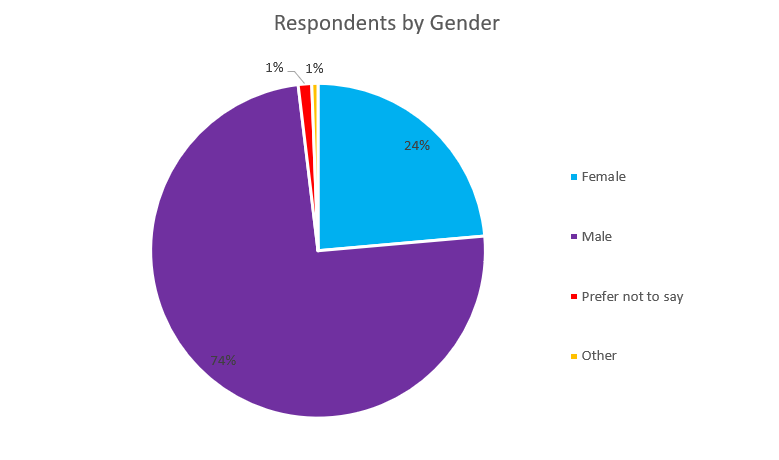
This reflects our membership as a whole (78% male and 22% female). If we compare to the CMS People Pipeline report, this quotes 35% of Tier 12 workers being female and 47% of Tier 23 workers.
“This suggests that there is a wider pool of females in mathematical employment than we are managing to attract and we should look at how we can become more attractive as an Institute to these employees.”
When we compare this percentage to other institutes the IOP have a larger percentage of female members, where the BCS and RAEng report smaller percentages. The 0.6% respondents who identified as other is smaller than the IOP’s 1.4% which is the only available comparison data.
Age
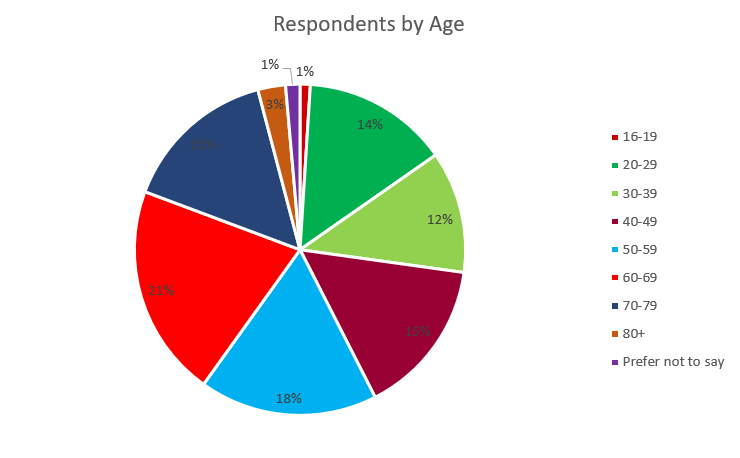
We asked respondents which age range they were in, see Figure 3, and this showed a good balance across the groups that reflected our membership data (43% of respondents were under 50 compared to 41% in our membership data).
This data is markedly different to the data from the CMS People Pipeline report where 71% of Tier 1 workers and 66% of Tier 2 workers were under 50, this may reflect employment retirement ages. The IOP’s data shows that 66% of respondents were under 50, with 44% being under 30, whilst RAEng data shows 62% being under 50.
“This suggests that the IMA would be wise to think about two aspects of this older age profile:
-
Are we catering well for our existing age demographic? More events and opportunities for experienced members might be appreciated, topics such as CPD for senior staff or CPD opportunities for those in retirement may be helpful. We should also look to accessibility as these members may find it more difficult to attend events in person (see caring below).
-
How do we ensure we continue to attract younger members to secure a future membership?”
Caring
19% of respondents answered that they have caring responsibilities, this is 5% higher than the IOP but 5% lower than the RAEng survey.
“We are currently seeking more information from our membership on the type of caring they are doing and how this may restrict their access to events and the other benefits of membership. Please contact us if you would like to tell us more.”
A recent BBC article4 based on Carers UK report, Will I care?5 quoted that:
“By the time they were 46, half of women had been a carer … while for men, it was not until they reached the age of 57 that they had the same 50-50 chance of being a carer.”
Therefore, it is possible that the high percentage of carers is related to our higher respondent age profiles.
Cultural Groups and Ethnicity
We asked respondents to identify the cultural group to which they felt they belonged, see Figure 4. The descriptions were those used in the 2011 UK census, although we noted the number of ethnic groups that were entered under “Other” by respondents.
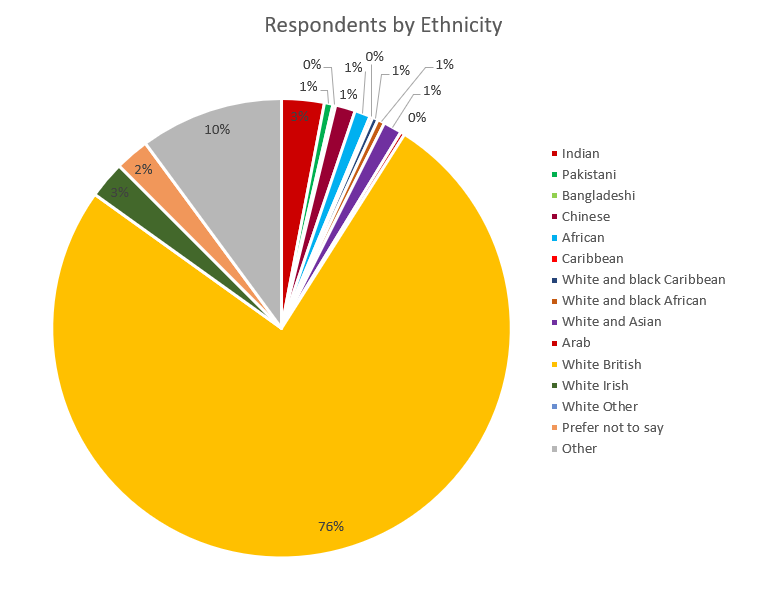
76% of respondents identified as White British, with the next highest number identifying as “Other” (10%) and Indian (3%). It was good to see that only 2.4% of respondents did not want to declare this, in contrast to almost 10% in the CMS People Pipeline.
“We had a similar proportion of BAME responses compared to the reported percentages in Tier 1 and Tier 2 mathematical jobs, and this is a higher percentage than many of the other institutes report; which we consider to be very positive.”
Some groups do appear to be under-represented here compared to data collected in the 2011 Census; however, some were about in line with background population.
Religion
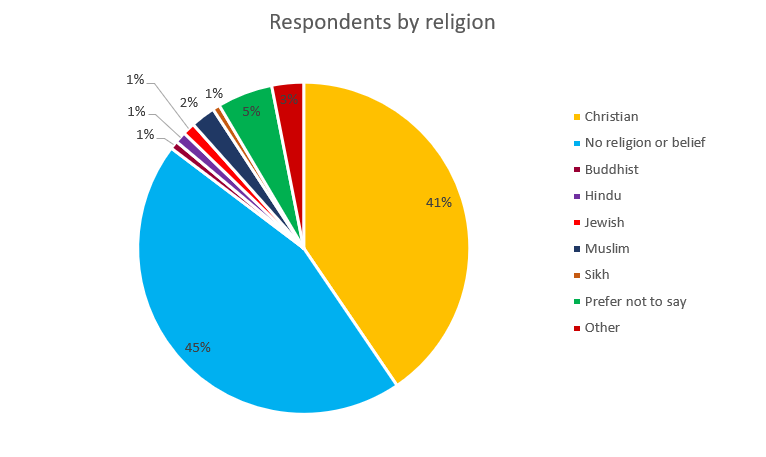
We had a high number of respondents declare that they identify as Christian 40.5% or “No religion or Belief” 44.8%, see Figure 5. This is similar to RAEng respondents, but differs from the IOP where 60% declared as “No religion or Belief”. This could be related to the differences in age profile of the membership populations.
“We were pleased to see representatives from all the major religions and this highlights the importance of inclusive considerations when choosing conference days (where Saturdays or Sundays might be rest days) and conference catering providing halal or kosher options. “
Disability
In response to the question about disability, impairment or long-term health conditions, 10.6% stated that they were disabled under the definition of the Equality Act 2010. This is inline with the percentages quoted in Tier 1 and Tier 2 mathematical employment by the CMS People Pipeline.
“10.6% is a higher percentage than many of the other institutes report, perhaps reflecting the greater accessibility of mathematics as a discipline.”
Sexual Orientation
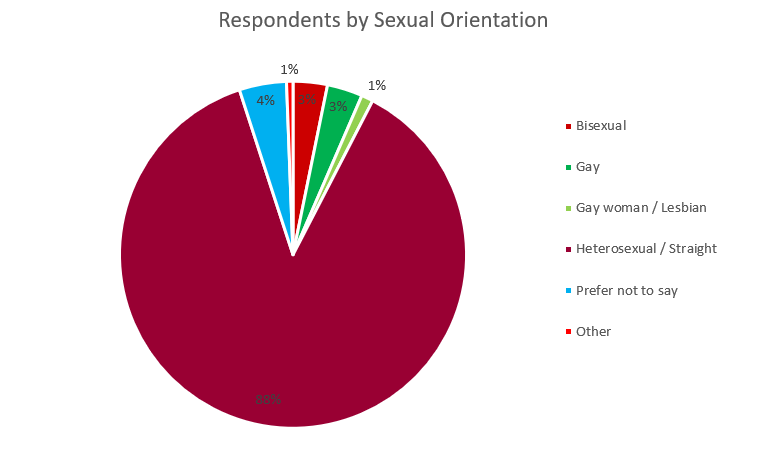
Figure 6 shows the respondents replies for the question about sexual orientation. It is interesting to note that 55 respondents preferred not to say. We have attracted a higher proportion of LGBTQ+ members than might be expected from RAEng working age data, but this is a lower proportion than quoted in the IOP member survey and this shows we could be attracting a more diverse membership.
“The IOP also attracts more bisexual members than we do, and this may also be a reflection of the difference in age profile of the respective memberships.”
Parental Education as a proxy for Socio-economic background
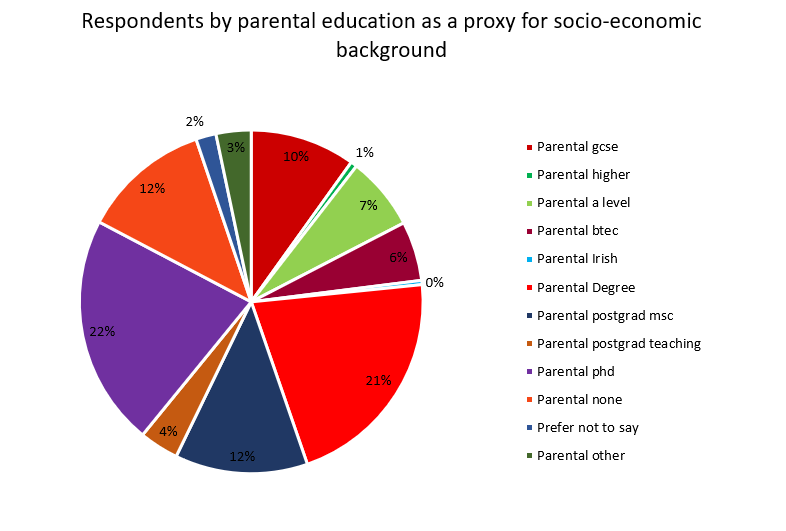
Socio-economic background data is very difficult to gather. In this survey we used the highest level of parental education as a proxy, as shown in Figure 7. This data shows that 28% of respondents had parents who had postgraduate qualifications, whilst a further 25% had parents who has degree level qualifications.
“This would appear to suggest that over half of our membership comes from a high socio-economic background. Indicating that we could do more to broaden our diversity here, by increasing our accessibility and appeal in order to widen participation.“
Next Steps
- This is the first diversity survey carried out by the IMA and the data collected forms a baseline to assess how effective our diversity policies are as we build on this in the future.
- We intend to carry out a further survey in 2021.
- We are keen to hear more about members’ caring responsibilities.
- We should look at how to attract more of the females working in mathematics Tier 1 and 2 employment.
- We should consider whether we are providing events and benefits that cater well to our current membership age demographic.
- We will continue to look at how to encourage more early career mathematicians.
Jenny Macey CMath CSci FIMA
IMA Diversity Champion
References
- CMS People Pipeline 2015 http://www.cms.ac.uk/wp/2015/10/28/the-mathematical-sciences-people-pipeline/, IOP diversity membership survey 2016 http://www.iop.org/publications/iop/2016/page_67245.html, BCS Diversity in IT 2017 https://cdn.bcs.org/bcs-org-media/4050/diversity-report-2017.pdf, RAEng https://www.raeng.org.uk/policy/diversity-in-engineering/business-benefits-key-facts/key-facts, https://www.raeng.org.uk/publications/other/understanding-the-culture-of-engineering, surveyed in 2017.
- Tier 1 are jobs where mathematics is considered essential.
- Tier 2 are jobs where mathematics is considered desirable.
- https://www.bbc.co.uk/news/education-50465922
- http://www.carersuk.org/images/News__campaigns/CarersRightsDay_Nov19_FINAL.pdf