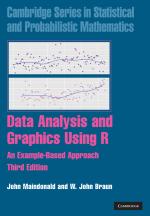
John Maindonald and W. John Braun
CAMBRIDGE UNIVERSITY PRESS 2010, 552 PAGES PRICE (HARDBACK) £50.00 ISBN 978-0-521-76293-9
 Much has been made over recent years of the need for academic research to contribute to the wider economy. Likewise, there have also been significant debates about the merits and effectiveness of peer review, and what information researchers should provide to facilitate this.
In addition to its value within the academic community, the R Language and Environment for Statistical Computing makes a positive contribution to both of these issues. Writing packages for R provides an easy way to make research products both more widely available and more easily used. In addition, such packages can readily facilitate peer review, by exposing not just the underlying data, but also the precise details of the approach that was adopted.
These benefits, along with the excellent quality of the core R software, mean that R is now widely used, both in academia and industry alike. Of course, R is not an end in and of itself: it is a vehicle to allow other tasks to be done. One such task is data analysis, which, as the title indicates, is the focus of this book.
The first chapter provides a brief introduction to R and contains more than enough information to allow a reader to follow the remainder of the text. This information is presented in a manner that integrates both the functionality of the software and the underlying statistical concepts. Even at this early stage there is, for example, a helpful discussion of how ‘non-available’ data items should be handled in a statistical analysis. This sets the tone for the remainder of the book, with the discussion of R and the discussion of statistical methods feeding off and reinforcing each other.
Subsequent chapters cover the expected range of topics (e.g. inference, regression, time series models, etc.). It is also pleasing to see a discussion of tree-based classification and random forests, the latter being an area that has been expanded in this third edition of the text. Although R is not the focus of these chapters, the necessary commands are provided, making it easy for the reader to follow along.
The final two chapters return to the specifics of R and cover more detailed topics, including the creation of packages and the generation of more advanced graphs.
A pragmatic approach is adopted throughout the book, with the authors passing on the benefit of their considerable experience. This is handled in an instructive and engaging way, with it being noted, for example, that “under torture, the data readily yield false confessions”.
The need for pragmatism is also nicely demonstrated by the data sets that have been chosen to illustrate the various techniques and concepts. In particular, these data sets are taken from actual studies: nothing has been sanitised for didactic purposes. The reader who follows the text will gain a realistic impression of the challenges that a statistician typically faces and the judgement that is often required to overcome these.
Some, but not all, of the chapters include a ‘Recap’ section. Where these are provided they are very helpful and it is curious why the author selected not to include them after every chapter. Perhaps the pressure on space was too great – at over 500 pages this is already a weighty tome!
An excellent set of exercises, which build on the material that has been discussed, is provided. It is apparent that these exercises, which are available for all but the final chapter, were not simply added as an afterthought. They have been carefully crafted to provide additional learning. Comprehensive references, and no less than three indexes, are also included.
The introduction to this review noted the importance and popularity of R, which has led to a plethora of related material being available. However, Data Analysis and Graphics Using R stands out as a giant amongst the crowd. The clarity of the text and the use of actual (rather than sanitised) data sets mean that it can act as a very useful guide for someone merely interested in data analysis. Likewise, the practical introduction to the use of R is also beneficial in its own right. The well-balanced combination of both aspects has produced a very valuable book, which is highly recommended.
Rob Ashmore CMath FIMA CSci
Defence Science and Technology Laboratory
Mathematics Today April 2012
The views and opinions expressed herein are those of the author and do not necessarily reflect those of the Defence Science and Technology Laboratory.
Data Analysis and Graphics Using R: An Example-based Approach (Third Edition) can be purchased at Amazon.co.uk