I recently stumbled across fertility stopping rules; fertility stopping or son-targeting means that a couple cease having children when (usually) they have one or two sons. This occurs mainly in developing countries, e.g. India, Pakistan, China, Turkey (e.g. [1]): thus, in India, sons are preferred to daughters for several reasons. Daughters need dowries to marry and so are expensive, whereas sons are more useful in working the land, and eventually running the family farm. They will also pass on the family name. Also, in Hinduism, only sons can perform the funerary rites for their parents [2,3]. One can see some of the social implications at once, that daughters will tend to have more siblings than sons, and will tend to be older than sons.
Initially, it merely occurred to me that working out the implications of these rules for simple probability models would be an excellent introduction to stochastic processes for students. What stochastic process could be simpler than a sequence of Bernoulli trials, with a probability  of ‘success’ (a son)? Students can easily check their results by simulation, for example the statistics package MINITAB and the MATLAB package allow the user to generate random data from the negative binomial distribution, which allows one to study stopping rules where reproduction stops with
  sons. This is also possible in languages such as R. The project can be made easier or harder, more or less analytic, and looks a very nice exercise.
However, I then realised that this topic is highly relevant in the new era of #MeToo, the Me Too movement. It has particular relevance as we approach International Women’s Day on 8 March, where the 2019 hashtag is #BalanceforBetter, with the theme of building a gender-balanced world. Fertility stopping penalises women in several ways, one of which is not initially obvious. However, I feel that the real evils are infanticide and neglect of unwanted girls. Policing son-targeting would be impossible at the level of the individual family, and would only exacerbate infanticide, prenatal sex selection and neglect of girls.
This article briefly explores both the pedagogic use of this topic and its implications for women’s welfare. These are related, as using fertility stopping as an example will stimulate discussion among students about the practice.
A simple model
In the simplest (not very realistic) model, parents stop producing children after the birth of a son, and any number of children can be produced. It is of course known that  ; in the UK the birth sex ratio (odds for getting a boy) is currently
  , so
, so  . Then the probability of
  offspring in a completed family is
  , the geometric distribution. Rules specifying no more than
  children are not difficult to study analytically, and then
  for
for  , but here the focus is on the simple case. The mean number of children is
  , so the mean number of siblings for a boy (mean number of girls) is one less, i.e.
  . In a family of children, each of the
  girls has siblings, so that for a girl, the mean number of siblings is

where the denominator is the mean number of girls per family.
In general, the expressions arising under this model can be evaluated by differentiating geometric series as done here, or simply by using the mean and variance of the geometric distribution, which are and  , respectively.
By using the geometric series
![\[ T = \sum_{n = 1}^\infty (1-p)^{n-1} = \frac{1}{p} \]](https://ima.org.uk/wp/wp-content/ql-cache/quicklatex.com-9e6b661a651691965ea6210aae8b50ed_l3.svg "Rendered by QuickLaTeX.com")
and evaluating
![\[ (1-p) \frac{\mathrm{d}}{\mathrm{d} p} \left( (1-p) \frac{\mathrm{d} T}{\mathrm{d} p} \right), \]](https://ima.org.uk/wp/wp-content/ql-cache/quicklatex.com-de6abbd993d56acaacffd333368c0e3e_l3.svg "Rendered by QuickLaTeX.com")
one obtains  , so that indeed girls have more siblings. In fact,
  more. This is the first way in which girls are disadvantaged, because in a larger family there are fewer resources per child. Note that girls have on average one brother, but
  sisters.
Turning to birth order, let the oldest child have birth order 1, and so on. For boys, average birth order is
![\[ \sum_{n = 1}^\infty nP_n = \frac{1}{p}. \]](https://ima.org.uk/wp/wp-content/ql-cache/quicklatex.com-7da519bd0b878267a8b5791fe41c0537_l3.svg "Rendered by QuickLaTeX.com")
This is of course equal to the average number of children, as the birth order of a boy equals the number of children in the family. For girls, the average birth order is
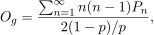
where  . By differentiating
  twice it follows that
  . Hence the average birth orders are the same for boys and girls. This seems counter-intuitive; the average birth order for boys should be greater, as they are born last. When boys are not the only child, the average birth order is
  , so that in families where the boy is not the only child, boys have a birth order on average 1 greater than girls.
What has been calculated is what Basu and De Jong [1] call the absolute birth order. Some practitioners also estimate and use the relative birth order. For the relative birth order, the birth order is averaged within families, and then averaged across families. In this case, the birth order for the boy in a family of size is , so the average relative birth order is . For girls, the relevant distribution has probability mass function  for
for  , i.e. a truncated geometric distribution. The mean is then
![\[ \sum_{n = 2}^\infty \frac{n}{2} \frac{P_n}{(1-p)} = \frac{(1 + p)}{2p}. \]](https://ima.org.uk/wp/wp-content/ql-cache/quicklatex.com-03166cf435d5c9676b82ad9f656dced2_l3.svg "Rendered by QuickLaTeX.com")
This is  , less than for boys.
The second way that girls are disadvantaged is that, being older, girls are likely to share in parenting younger siblings, and to do more housework [1].
In industrialised nations, it is thought that many parents stop childbearing when they have ‘one of each’ [4]. This is again fairly straightforward analytically: with probability  the first child is a girl, and one carries on until a boy is born, and with probability the opposite situation obtains. This gives a probability
  for . The properties of the geometric distribution can be used to find the mean number of girls born as
  , the mean number of boys as
  , and the mean number of offspring as
  . The mean number of siblings per girl is

The first term covers the case of son-targeting as before, and the second term covers daughter-targeting. Here the number of siblings of the single girl in a family of size is . The expression reduces to
![\[ M_g = \frac{(1-p)^2(2-p) + p^3}{p(1-p)\{1-p(1-p)\}}. \]](https://ima.org.uk/wp/wp-content/ql-cache/quicklatex.com-04725e1f8d926d983535589d3de62301_l3.svg "Rendered by QuickLaTeX.com")
This is  . For boys,
  .
.
The sex ratio at birth
The slight excess of boys over girls varies with time and place, and has been of interest for a long time. It was noticed by John Graunt in 1662, and in 1741 it was seen by the statistician and theologian Johann Süssmilch as evidence of divine providence that more boys were born because of the greater mortality of males [5]:
Everything is arranged according to definite numbers and proportions
Now, as man contributes little or nothing to all this, and mere accidental events are chimeras worthy of derision, we are strengthened in the truth that God cares for the human race.
Currently, the accepted model is of Bernoulli trials where depends slightly on the mother’s age and circumstances. To my shame, it was not immediately obvious to me that the practice of these stopping rules under the simple Bernoulli trials model has no effect on the sex ratio of the newborn. I am by no means the first researcher to be puzzled or misled by this: probability is tricky! But one soon sees that, whatever stopping rules are practised, each child born has probability of being a boy, so the sex ratio at birth is not affected by stopping rules.
In reality, however, under a more realistic model, fertility stopping rules do change the sex ratio. Gellatly [6] describes a convincing model, in which a gene for producing more sons causes men to produce more sperm carrying the Y chromosome. Hence men with many brothers tend to produce more male offspring. This is a male-expressed autosomal (not sex-linked) gene, carried also by women but only active in men. The  allele codes for greater production of
  sperm, and the
  allele for greater production of
  sperm. The gene, which has not yet been found, would produce men with 3 levels of tendency to father males, i.e.
  ,
,  ,
,  .
.
With this or some other similar mechanism for the birth sex-ratio to vary, stopping rules will reduce the proportion of males born from generation to generation. For simplicity, consider sub-populations of men who produce sons with probabilities  and
and  , and let the proportions of these be
  and
and  , respectively. Under the 1-son stopping rule, the expected numbers of offspring per man are
  and
and  . Hence in the next generation, the proportions will be
  and
and  , where
![\[ q' = \frac{q/p_1}{q/p_1 + (1-q)/p_2} = \frac{qp_2}{qp_2 + (1-q)p_1}. \]](https://ima.org.uk/wp/wp-content/ql-cache/quicklatex.com-1c896f7f54d6eab2d98b2c2f278eb3af_l3.svg "Rendered by QuickLaTeX.com")
Hence,
![\[ q'-q = \frac{q(1-q)(p_2-p_1)}{qp_2+(1-q)p_1}, \]](https://ima.org.uk/wp/wp-content/ql-cache/quicklatex.com-63f22e6e7177c8fea96c1101b9bb3e5f_l3.svg "Rendered by QuickLaTeX.com")
so that if  , the frequency of decreases. The gene for producing more sons leads to fewer offspring, and so progressively dies out. This is also true under a ‘proper’ model of how allele frequency changes under selection pressure. The selection of the allele makes the remark of Seidl [7] even truer: ‘the desire for sons is the father of many daughters.’ Son-targeting increases the proportion of women born, and if
  , the proportion of women at birth would eventually exceed the proportion of men, instead of vice versa as now.
This is the third way in which fertility stopping rules can penalise women: they cause the proportion of males born to gradually decrease, leading to an excess of adult women in the population, with the consequent difficulty of finding a partner and having a family. This disadvantage would result in a yet keener desire for sons, setting up a vicious cycle.
Data analysis
For completed fertility data analysis, a more realistic model is needed. Here it is best not to impose a parametric form on the probabilities  of the number of children born. One way to proceed is as follows: define the discrete ‘hazard’ of stopping at
  children as
![\[ h_i = \frac{P_i}{1-\sum_{j = 1}^{i-1}P_j}, \]](https://ima.org.uk/wp/wp-content/ql-cache/quicklatex.com-9b968db1bf922b81a0f0e092406c13a0_l3.svg "Rendered by QuickLaTeX.com")
the probability that a couple stop at children given that they have at least . Since  is a probability, it can be modelled using the logistic model
![\[ h_i = \frac{1}{1 + \exp(-\alpha_i-{\boldsymbol \beta}_i^T{\textbf{X}}_i)}, \]](https://ima.org.uk/wp/wp-content/ql-cache/quicklatex.com-21fe063eb25621fcc7634632885e9a56_l3.svg "Rendered by QuickLaTeX.com")
where  is a vector of coefficients and
  a vector of demographic variables, such as mother’s age, and history variables, such as the number of sons born so far. The odds ratio is
![\[ \frac{h_i}{1-h_i} = \frac{P_i}{\sum_{j = i + 1}^\infty P_j}. \]](https://ima.org.uk/wp/wp-content/ql-cache/quicklatex.com-8806dba9d6938fec66a213b5b36b7148_l3.svg "Rendered by QuickLaTeX.com")
It is then straightforward to compute the as
![\[ P_i = h_i\prod_{j = 1}^{i-1}(1-h_j). \]](https://ima.org.uk/wp/wp-content/ql-cache/quicklatex.com-6155e1080e8438f643790a0db7ed655b_l3.svg "Rendered by QuickLaTeX.com")
Naturally, one would chop off the probabilities at children, when the highest probability would be for  children, and the model parameters would be the parameters of
  , i.e. the
  and . The likelihood function for one family with
  girls and
  boys would then be
  . The estimation of and of the stopping parameters are independent.
Fahrmeir [8] discusses this and other discrete models.
Conclusions
Fertility stopping disadvantages women. It is a less obviously unpleasant thing than female infanticide or prenatal sex selection, but very simple mathematics can show the unfortunate effects in terms of young women sharing resources with more siblings, and being older than siblings, which means taking on something of a parental role [1]. A less obvious harm is the way that fertility stopping can lead to a lowering of the birth sex ratio, so that a surplus of women is produced. Admittedly, Gellatly’s sex ratio gene has not yet been found, but his theory can convincingly explain the observed heritability of the parental sex ratio by males, but not by females.
On the pedagogic front, studying fertility stopping would be a nice lead-in to the study of stochastic processes, or of discrete distributions.
Rose Baker CMath FIMA
University of Salford
- It will appear to be if infanticide of female babies is performed; sadly this clearly has occurred in China and elsewhere. Prenatal sex selection is also practised, where typically female foetuses are aborted after the birth of one or two daughters. This is somewhat euphemistically termed ‘family balancing’.
References
- Basu, D. and De Jong, R. (2010) Son targeting fertility behavior: some consequences and determinants, Demography, vol. 47, pp. 521–536.
- Arnold, F., Choe M.K. and Roy T.K. (1998) Son preference, the family building process and child mortality in India, Popul. Stud., vol. 52, pp. 301–315.
- Clark, S. (2000) Son preference and sex composition of children: evidence from India, Demography, vol. 37, no. 1, pp. 95–108.
- Hank, K. (2007) Parental gender preferences and reproductive behaviour: a review of the recent literature, J. Biosoc. Sci., vol. 39, pp. 759–767.
- Crum, F.S. (1901) The statistical work of Süssmilch, Publ. Am. Stat. Assoc., vol. 7, no. 55, pp. 1–46.
- Gellatly, C. (2009) Trends in population sex ratios may be explained by changes in the frequencies of polymorphic alleles of a sex ratio gene, Evol. Biol., vol. 36, pp. 190–200.
- Seidl, C. (1995) The desire for a son is the father of many daughters, J. Popul. Econ., vol. 8, pp. 185–203.
- Fahrmeir, L. (1997) Discrete failure time models, Sonderforschungsbereich 386, Paper 91, University of Munich.
Reproduced from Mathematics Today, February 2019
Download the article, Fertility Stopping Rules (pdf)