The Poisson match is a mathematical model of a sport in which two teams convert possession into points, e.g. soccer, rugby union, netball and water polo. For a given sport, a mathematician might ask two basic questions: (1) Is this model a good one? (2) What can this model tell us about the sport? Here, the given sport is rugby union and the short, provocative answers to these questions are: (1) yes, the model is a good one and (2) there is too much scoring in rugby union and the sport should consider changing its rules.
For the longer answers, please read on.
Let (X1, X2) be the final score in a match between team 1 and team 2. Then we call (X1, X2) a Poisson match when X1 ∼ Po(λ1) and X2 ∼ Po(λ2) independently; that is, when the scores of each team follow Poisson distributions that are independent with means λ1 and λ2. The following results can be proved [1]:
- If λ1 = λ2 = λ then Pr(X1 < X2) = Pr(X1 > X2) → 1/2 as λ → ∞.
- If λ1 = λ and λ2 = ελ, then for any ε > 1, Pr(X1 > X2) → 0 as λ → ∞.
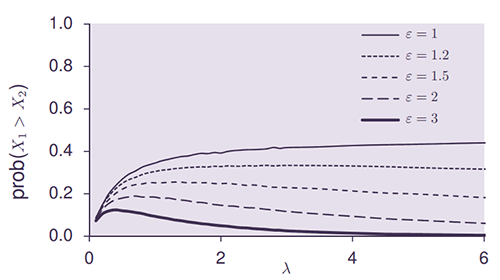
Result (i) says that in a balanced match (equal strengths), as the scoring rate (λ) increases, firstly ties (draws) vanish and secondly the outcome becomes completely uncertain. Intuitively this result is obvious, as is the fact that, as λ → 0, the outcome becomes certain, since in the limit no team scores and the match outcome is 0–0 with probability 1. Result (ii), represented graphically in Figure 1, is equally intuitive: when team strengths are unequal, an increasing scoring rate favours the stronger team and in the limit the weaker team always loses. Further, this is true no matter how closely matched the teams are. Notice that ε quantifies the relative strengths of the teams (team 2 is ε times as good as team 1). Finally, when ε > 1 there exists a scoring rate in a Poisson match that maximises the uncertainty of the outcome. For example, when ε = 2, λ = 1 approximately maximises the uncertainty. When ε = 2 and λ = 1, X1 ∼ Po(1) and X2 ∼ Po(2); we call this a 2–1 game.
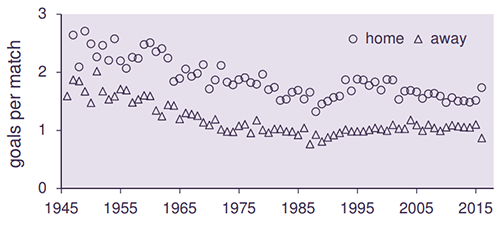
Figure 2 suggests that soccer is indeed a 2–1 game and a detailed analysis of scores (e.g. [2]) indicates that soccer is well approximated by a Poisson match. Thus, soccer appears to be a game that gives the weak the greatest sporting chance.

Rugby union, on the other hand, has a scoring rate that is much higher and that has increased over time (Figures 3 and 4). In the 1960s, rugby was effectively a 4–2 game; now it is an 8–4+ game. We can speculate about why there is more scoring now than in the past: increased penalty kick success, better pitches, and rule changes that lead to more open play (maul laws) and penalise defensive play (line-out laws). Arguably, such rule changes have neglected the excitement derived from close outcomes.

The relative importance of athleticism (skill, speed, flair and power), narrative (celebrity, controversy and value) and uncertainty of the outcome to the popularity of a sport is unknown. Nonetheless, an uncertain outcome is generally perceived by administrators of sport as a good thing.

Focusing on the number of scores rather than the points value of the scores, rugby is reasonably approximated by a Poisson match [1]. So, there is a case for narrowing the goalposts, so that there are more close matches, more upsets, and thus, more suspense, more surprises, more talking about matches decided by dubious decisions, and fewer teams on the receiving end of a hammering.
How might scoring rates be reduced? Here is a proposal: turn the clock back some 150 years and award 0 points for a try and 1 point for the conversion, and abolish the penalty goal and drop goal. Thus, a team would try to convert a try into points. This is the etymology of these words.
What would be the implications of this proposal? Let us build a mathematical model of a tournament and study a simulated tournament outcome under the existing scoring rules and under the proposal. We use the Poisson match to model match outcomes. Each team i has a try attack strength αi, try defence strength βi and a conversion success rate pi, which are constants for the duration of the tournament. The numbers of tries by team 1 and team 2 in the match team 1 v team 2 is a Poisson match with λ1 = α1/β2 and λ2 = α2/β1. Penalties and drop goals are treated similarly to tries and independently. Home advantage is accommodated through an additional parameter. Match outcome is then an 8-variate, and the points value of scores (5 for a try, 2 for a conversion, 3 for a penalty and 3 for a drop goal) determine the final score.

Strength parameters were estimated (by the method of maximum likelihood) using data from matches played between the 20 teams that competed in the 2015 Rugby World Cup (RWC) (942 matches from 4 February 2006 to 26 February 2017). An extract of the parameter estimates is shown in Table 1. Then, for example, in a match between New Zealand (NZL) and Wales (WAL) on neutral ground, we would expect New Zealand to score 1.00/0.27 = 3.7 tries and Wales 1.0 tries. Mean conversion numbers would be 2.7 and 0.8, respectively; penalties 2.4 and 2.1; and drop goals 0.1 and 0.1. Under the existing scoring rules, the expected final score is then (31, 13) points (or (9, 4) in numbers of scores). Similarly, (56, 8) (or (16, 2)) is the expected score when New Zealand play Georgia (GEO), and (109, 6) (or (30, 2)) when New Zealand play Namibia (NAM).
 Under the proposed, revised scoring rules, we assume try strength parameters are unchanged. We consider two conversion scenarios: (1) unchanged conversion rates and (2) conversion rates that are halved. The latter might be achieved by narrowing the posts, raising the bar or drop-kicking the conversion! Then the expected final scores for New Zealand v Wales, New Zealand v Georgia and New Zealand v Namibia under the first scenario would be (3, 1), (6, 1) and (12, 0), respectively, and (1, 0), (3, 0) and (6, 0) under the second scenario (all to the nearest integer).
The tournament structure and team assignment are at: en.wikipedia.org/wiki/2015_Rugby_World_Cup (four pools of five teams playing a round robin, pool B winner v pool A runnerup, etc.). Complicated progression rules (e.g. bonus points and tie-breakers) were implemented in the simulation. In the simulation, in knock-out rounds (KO), a ‘coin toss’ determined the outcome of tied matches. Outcome probabilities for the simulated RWC 2015 tournament for a subset of teams are shown in Table 2.

Now imagine a league (a home and away, round-robin tournament) of the same 20 teams. This is the structure of the English Premier League (soccer). Using the same strength parameters as above, and awarding 3 points for a win, 1 for a draw and 0 for a loss, the league outcomes are shown in Table 3. Also shown is the outcome of an imagined league of the top 20 international soccer teams and the final table of the 2018/19 Premier League; these provide benchmarks for competitiveness, with notionally the distribution of league points quantifying the competitive balance of the league.
The results are as expected. A few points are notable. As scoring rates decrease, while tournaments become more competitive, the rank order of teams is largely unchanged. Thus, the best remain so but win less often. The weak tail in rugby is very weak relative to that in soccer. There is less dominance in international soccer than domestic soccer. Draws (tied matches) are more frequent in more competitive tournaments (final row in Table 3).
In the simulation of RWC 2015, under the existing scoring rule, 5% of World Cup finals were tied at half-time and 3% at full time. This increased to 30% and 15% under the revised scoring rule, and to 42% and 25% when conversion rates are halved. Note: 7 out of 20 soccer World Cup finals were tied at full time. Of course, overtime could be used to guarantee a winner in all ties (cf. American football and basketball). However, closer matches on average imply more surprises and more suspense. We can speculate about how infringements might be penalised, how play may adapt and unintended consequences [3].

Our point – pun intended – may be considered frivolous, our suggestion for reform even more so. It may not be supported by results in domestic competitions. Nonetheless, two important points remain. First is that the relationship between scoring rate and outcome uncertainty has been largely overlooked because most studies have focused on soccer where the scoring rate is low and not increasing. The second point is that sports rulemakers in general should take care that rule changes introduced to increase entertainment do not favour the strong.
Phil Scarf CMath FIMA
University of Salford
Rishikesh Parma
Indian Institute of Technology, Dhanbad
Ian McHale
Univerisity of Liverpool
Notes
- Country codes are from users.skynet.be/hermandw/if/ifrug.html
- Soccer codes are from liaison.reuters.com/tools/sports-team-codes
References
- Scarf, P.A., Parma, R. and McHale, I. (2019) On outcome uncertainty and scoring rates in sport: the case of international rugby union, Eur. J. Oper. Res., vol. 273, pp.721–730.
- McHale, I. and Scarf, P.A. (2011) Modelling the dependence of goals scored by opposing teams in international soccer matches, Stat. Model., vol. 11, pp. 219–236.
- Kendall, G. and Lenten, L. (2017) When sports rules go awry, Eur. J. Oper. Res., vol. 257, pp. 377–394.
Reproduced from Mathematics Today, August 2019
Download the article, A Point on Conversion: Scoring in Rugby Union (pdf)